Comparing contrails and CO2
This technical primer highlights key differences between contrail and CO2 warming and provides guidance on ways to make meaningful comparisons of the two.
We’ve received lots of questions about how to compare the warming impact of contrails with CO2 emissions. This technical primer highlights key differences between contrail and CO2 warming and provides guidance on ways to make meaningful comparisons of the two. The post is geared towards airline users of our group's flight emissions reports, but will help anyone working to understand the difference between contrail and CO2 warming.
Key points
- The climate impacts of contrails and aviation CO2 emissions are fundamentally different because the lifetime of contrails is much shorter than the lifetime of CO2.
- Contrail warming today is the result of contrails over the past day. Aviation CO2 warming today is the result of aircraft CO2 emissions from the past 80 years.
- We can compare the warming from future contrails and aviation CO2 by estimating when accumulated CO2 produces the same warming as continuous contrail coverage.
Aviation warms the planet by emitting carbon dioxide and forming contrails. One natural question is to ask how important each is relative to the other. A common answer—which we even provided in our first notebook post—is that contrails and aviation CO2 emissions are responsible for similar amounts of warming. This answer is simple, startling, and dangerously easy to misinterpret. Specifically, it does not imply that the average individual flight produces contrails and CO2 emissions with similar climate impacts. This primer aims to explain how the climate impacts of contrails and CO2 differ and why these differences matter.
The key difference between contrails and CO2: Contrails warm the planet a huge amount for a very short period of time. CO2 emissions produce a relatively small amount of warming that lasts (essentially) forever. Climate scientists often report the intensity of warming at a specific point in time in terms of an “effective radiative forcing”, or ERF. Lightbulbs provide a useful analog for understanding ERF: increasing ERF by 1 W/m2 is like switching on a 100 Watt lightbulb for every 10-by-10 meter patch of earth. Higher ERF heats the planet more rapidly and causes more warming, about 1 degree Celsius (C) for every 2 W/m2 of ERF.
Contrail ERF is like a camera’s flash. A single flight’s contrails can produce very high ERF values. But because contrails are extremely short-lived (even the most persistent of persistent contrails dissipate within hours of formation), the ERF only lasts a short period of time.
CO2 ERF is like a dim LED bulb left on. The CO2 emissions from a single flight produce relatively low ERF. But because CO2 emissions have an extremely long atmospheric lifetime (about 25% of all emitted CO2 remains in the atmosphere essentially forever), the ERF lasts for millennia.
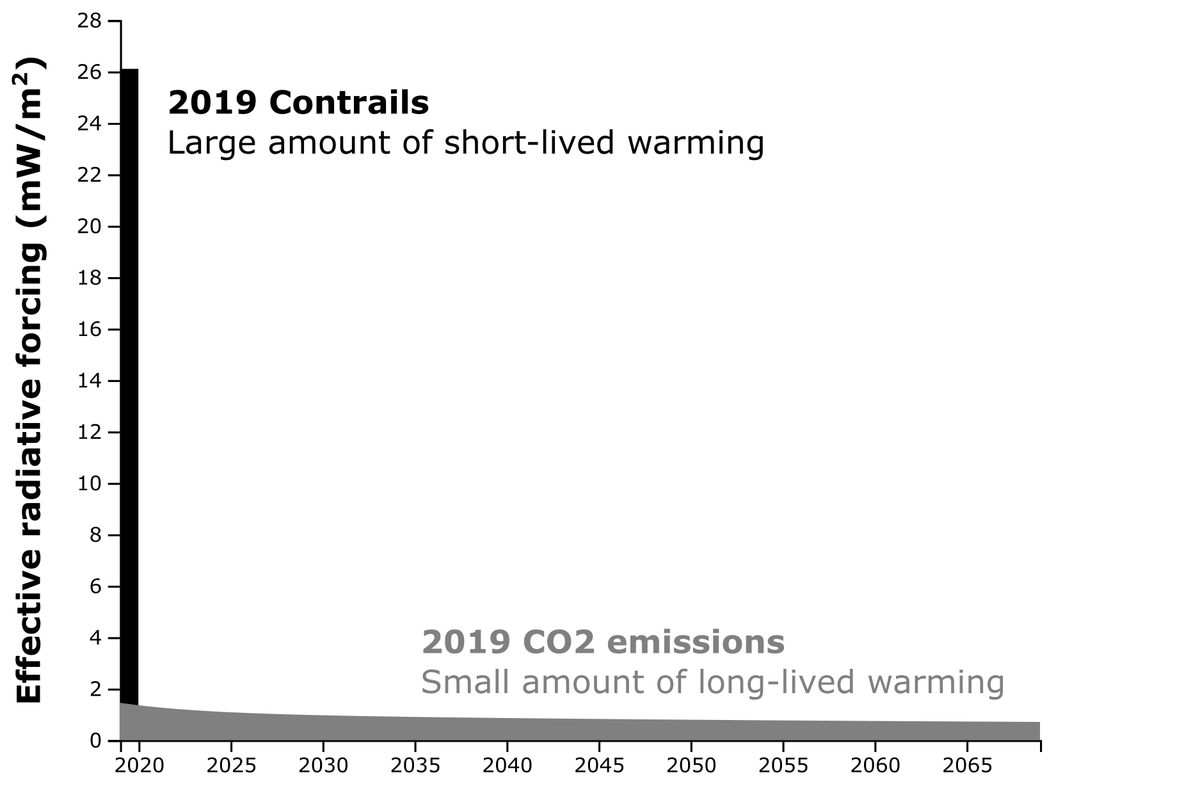
The difference is obvious in a plot of contrail and CO2 ERF from flights in 2019.[1] During 2019—when 2019 flights were in the air, maintaining a near-continuous burst of contrail “camera flashes”—the ERF from contrails was much larger than the ERF from CO2 emissions. After 2019, the camera flashes stop and contrail ERF drops to zero, but the CO2 “LEDs” turned on during 2019 continue to shine for a long time.

If these impacts are so different, why do we keep hearing that they cause a similar amount of warming? The somewhat unsatisfying answer is that its essentially a historical coincidence. In 2019, the total ERF from aviation included large contributions from contrails and small contributions from the CO2 emitted by 2019 flights. However, (crucially) it also included a large contribution from CO2 emitted by flights before 2019. The ERF from cumulative aviation CO2 emissions 1940–2018 happens to be similar to the ERF caused by contrails in 2019. There is no reason the two values had to be similar—it just so happens that they were.

Coincidence or not, the fact that contrails and aviation CO2 emissions currently produce similar (significant) amounts of warming means there is justifiable interest in addressing both. We can’t do much about emissions from past flights, but it would be helpful to compare the climate impacts of contrails and CO2 emissions from future flights.
One approach is to compare future contrails and CO2 by converting contrail warming into CO2 equivalent emissions (CO2e). This approach is understandably appealing: if there were a single objectively-correct way to map contrail warming to CO2 equivalent, we could design interventions with the straightforward goal of minimizing the sum of the CO2 emissions and CO2-equivalent contrail warming for every flight. Unfortunately, no single objectively-correct conversion exists.
Because contrails and CO2 emissions have such vastly different lifetimes, computing contrail CO2 equivalents requires subjective decisions about the relative importance of short-term warming from contrails versus long-term warming from CO2. The subjectivity doesn't mean equivalence metrics have no practical value (they can be useful as standards for reporting climate impacts, or for integrating contrail warming into the cost functions of flight planning systems), but it does mean they are better viewed as indicators of future impacts rather than as comprehensive measures on their own.
Case study: CO2 versus contrail CO2e for "Notrace Airlines"
Let's imagine we work for the fictional Notrace Airlines and receive a summary of CO2 emissions and contrail warming produced by our 2024 flights. We are told that these flights emitted 10 Megatonnes (Mt, millions of tonnes) of CO2 from fuel burn and had contrail warming impact of 6 Mt CO2e (calculated using a global warming potential—GWP—with a 50 year time horizon). These values are typical for a year of flights from an airline with about 1% global market share. We know we shouldn't read too deeply into a direct comparison of CO2 emissions with contrail CO2 equivalents, so how do we use these numbers to develop a deeper understanding our flights' climate impact?
One way is to estimate how long it takes Notrace flights to emit enough CO2 to match the effective radiative forcing (ERF) caused by the flights' contrails. By continuously flying aircraft, Notrace maintains continuous contrail coverage (a continuous burst of “camera flashes”). This contrail coverage produces an ERF of 0.3 mW/m2, which will remain roughly constant as long as Notrace continues to fly at 2024 traffic levels.[2]
By continuously flying aircraft, Notrace flights also continuously emit CO2 (increasing the number of “dim LEDs”). The 10 Mt of CO2 emitted in one year produces at most 0.02 mW/m2 ERF on its own. The slow accumulation of CO2 emissions means that continuing to fly at 2024 traffic levels causes CO2 ERF to overtake contrail ERF after about 25 years. This break-even point provides a simple way to compare the impact of contrails and CO2 emitted by Notrace flights: it will take about 25 years of CO2 emissions to produce CO2 ERF equal to the continuously maintained contrail ERF. (In terms of the lightbulb analogy, it takes about 25 years for Notrace to turn on enough dim CO2 LEDs to equal the brightness of their constant contrail camera flashes.) Calculating this break-even point makes assumptions about the way Notrace Airlines will operate in the future—namely, that yearly contrail and CO2 emissions will neither increase nor decrease—but is free from subjective judgements about the relative importance of short- versus long-term warming.

To recap
Why is it important to understand these details? From a practical point of view, its important to build intuition about how contrails and CO2 emissions actually affect the future. Despite their subjectivity, CO2 equivalents are widely used as a standard format for reporting contrail warming, including in flight emissions reports that our own group generates. The ability to construct future scenarios from reported CO2 equivalents opens the door to exploring, in very concrete and objective terms, how future flights will affect climate with and without interventions like contrail abatement or a transition to sustainable aviation fuels. (Stay tuned—We're developing scenario-exploration tools for use with our flight emissions report.)
Second, and perhaps more importantly, understanding the details behind contrail-CO2 comparisons helps underscore why action on contrails cannot be an excuse for failing to reduce CO2 emissions. Contrails and CO2 emissions both matter, and the vast difference in their atmospheric lifetimes means there is no meaningful sense in which one can be traded for the other.[3] Reductions in contrail coverage and CO2 emissions are both beneficial: both lead to lower radiative forcing and less climate warming. While contrail reduction offers a crucial near-term opportunity to reduce a significant amount of global warming, nobody should view contrail management as a substitute for decarbonization. Doing so falsely equates the temporary impacts of contrails with the essentially irreversible impacts of CO2 emissions.
Footnotes
- For this plot, we use results from Teoh et al. “Global Aviation Contrail Climate Effects from 2019 to 2021.” Atmospheric Chemistry and Physics (2024). The 2018 Contrail ERF cited by Lee et. al (2021) is a bit higher (57 mW / m2), but for the sake of this primer the takeaway is the same.
- Contrail ERF and CO2-equivalent contrail warming are related by
Contrail ERF [mW/m2] = 0.05 mW/m2/(Mt/year) * Contrail CO2e [Mt, GWP50 basis] / T [years]whereTis the is the duration of the time period over which the contrails responsible for the warming formed. For Notrace Airlines, the contrails responsible for producing 6 Mt CO2e of contrail warming formed over a period of 1 year. Inserting 6 Mt forContrail CO2eand 1 year forTgives an ERF of 0.3 mW/m2. - Contrail avoidance often requires a small amount of additional fuel (~ 1% added fuel per avoidance flight). This post did not cover the practical challenge of trading off contrail reductions with added fuel emissions. This is a topic of active discussion, which we'll cover in a future post.