Contrails are back in Google Flights
This post describes new contrail classifications in the Travel Impact Model (implemented by Google Flights) that help travelers identify flights with the lowest expected contrail impacts.
We're excited to host our first guest author, Jayant Mukhopadhaya, from the International Council on Clean Transportation (ICCT). Jayant is a Senior Researcher on Aviation, leading ICCT's work on contrails.
Flight booking platforms have long provided greenhouse gas (GHG) emission estimates, but have recently started classifying contrail impacts too. This post describes recent updates to the Travel Impact Model (TIM) to include contrail impacts and how these estimates can help climate-conscious travelers choose flights with the lowest expected climate impact.
The International Council on Clean Transportation (ICCT) recently published a report showing contrail avoidance can complement GHG mitigation to deliver up to 90% reduction in aviation's climate warming by 2050. As we become more aware of contrail impacts, climate-conscious air travelers will reasonably ask what individuals can actually do about it.
Realistically, individual travelers have little influence on aircraft efficiency, flight routing, or the energy systems that power aircraft. But we can choose the flight itinerary with the lowest estimated climate impact.
For years now, flight booking platforms have provided greenhouse gas (GHG) emission estimates at the time of booking. Platforms sometimes highlight more efficient flight options and even allow customers to sort by lowest GHG emissions.
For many popular booking platforms (Google Flights, Expedia, and Booking.com), these GHG estimates are powered by the Travel Impact Model (TIM). The TIM is an open-source model for calculating aviation emission estimates based on public datasets and the latest science, governed by an independent expert Advisory Committee that is led by ICCT and Google.[1]
Google published the first version of the TIM in 2022. After years of feedback and improvement, we're confident in the estimate of a flight's GHG emissions. These models use reliable physics and can be compared with actual fuel burn data as ground truth.[2]
Recently the TIM has been extended to cover aviation's contrail impact. Contrails are trickier–contrail warming depends on the weather conditions at flight time, and this can be predicted at best a few days in advance. That makes it nearly impossible to give a reliable number for any specific future flight's contrail warming effect at booking time.
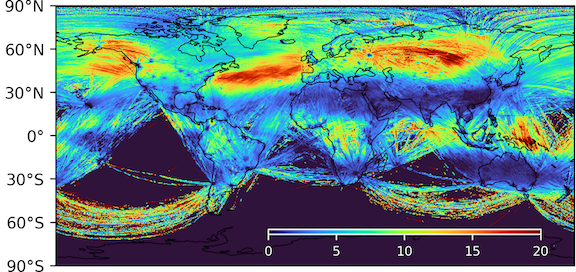
But we can still observe trends in contrail impacts if we look across time and space. For example, nighttime contrails are always warming (no sunlight to reflect), and certain latitudes produce fewer contrails due to large-scale atmospheric circulations (Teoh et al. 2024). We can use these trends to differentiate between flight options, even when absolute values remain uncertain.
How does the TIM classify contrail impacts?
Since we can't predict the weather weeks in advance, the TIM uses a climatological approach–looking at historical patterns to estimate the impact of a flight based on factors we do know at booking time: the route, time of day, and season. A climatological estimate is unlikely to be accurate for a specific flight, but it's directionally accurate when averaged over the course of a year or season.
This section provides a high-level overview of the TIM contrail classification model. For the full details, see the Travel Impact Model technical briefs.[3]
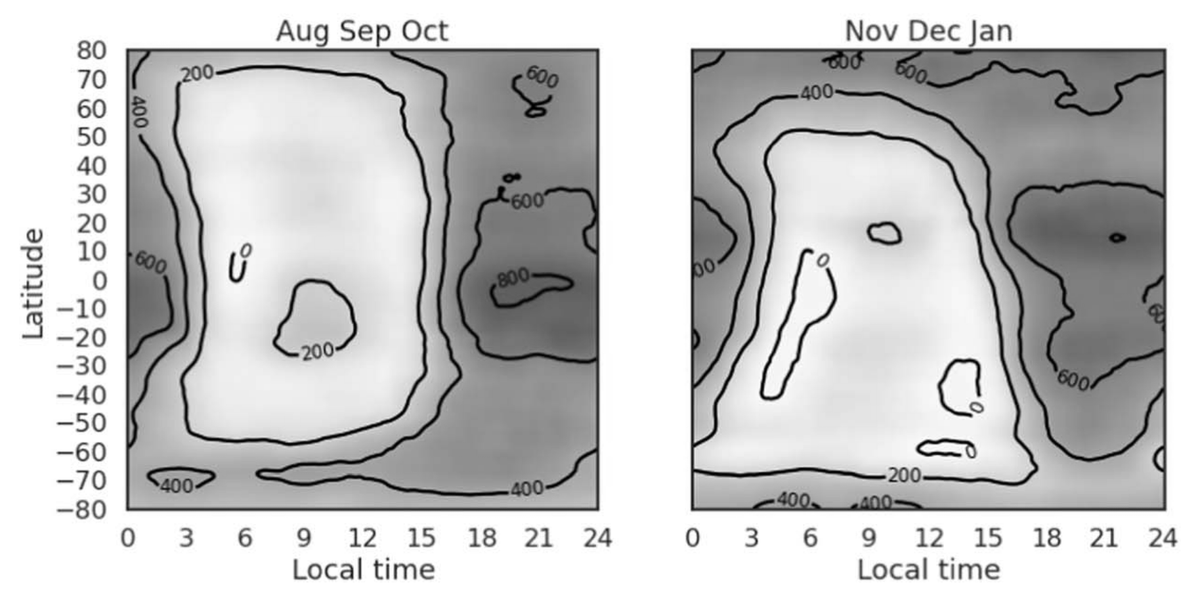
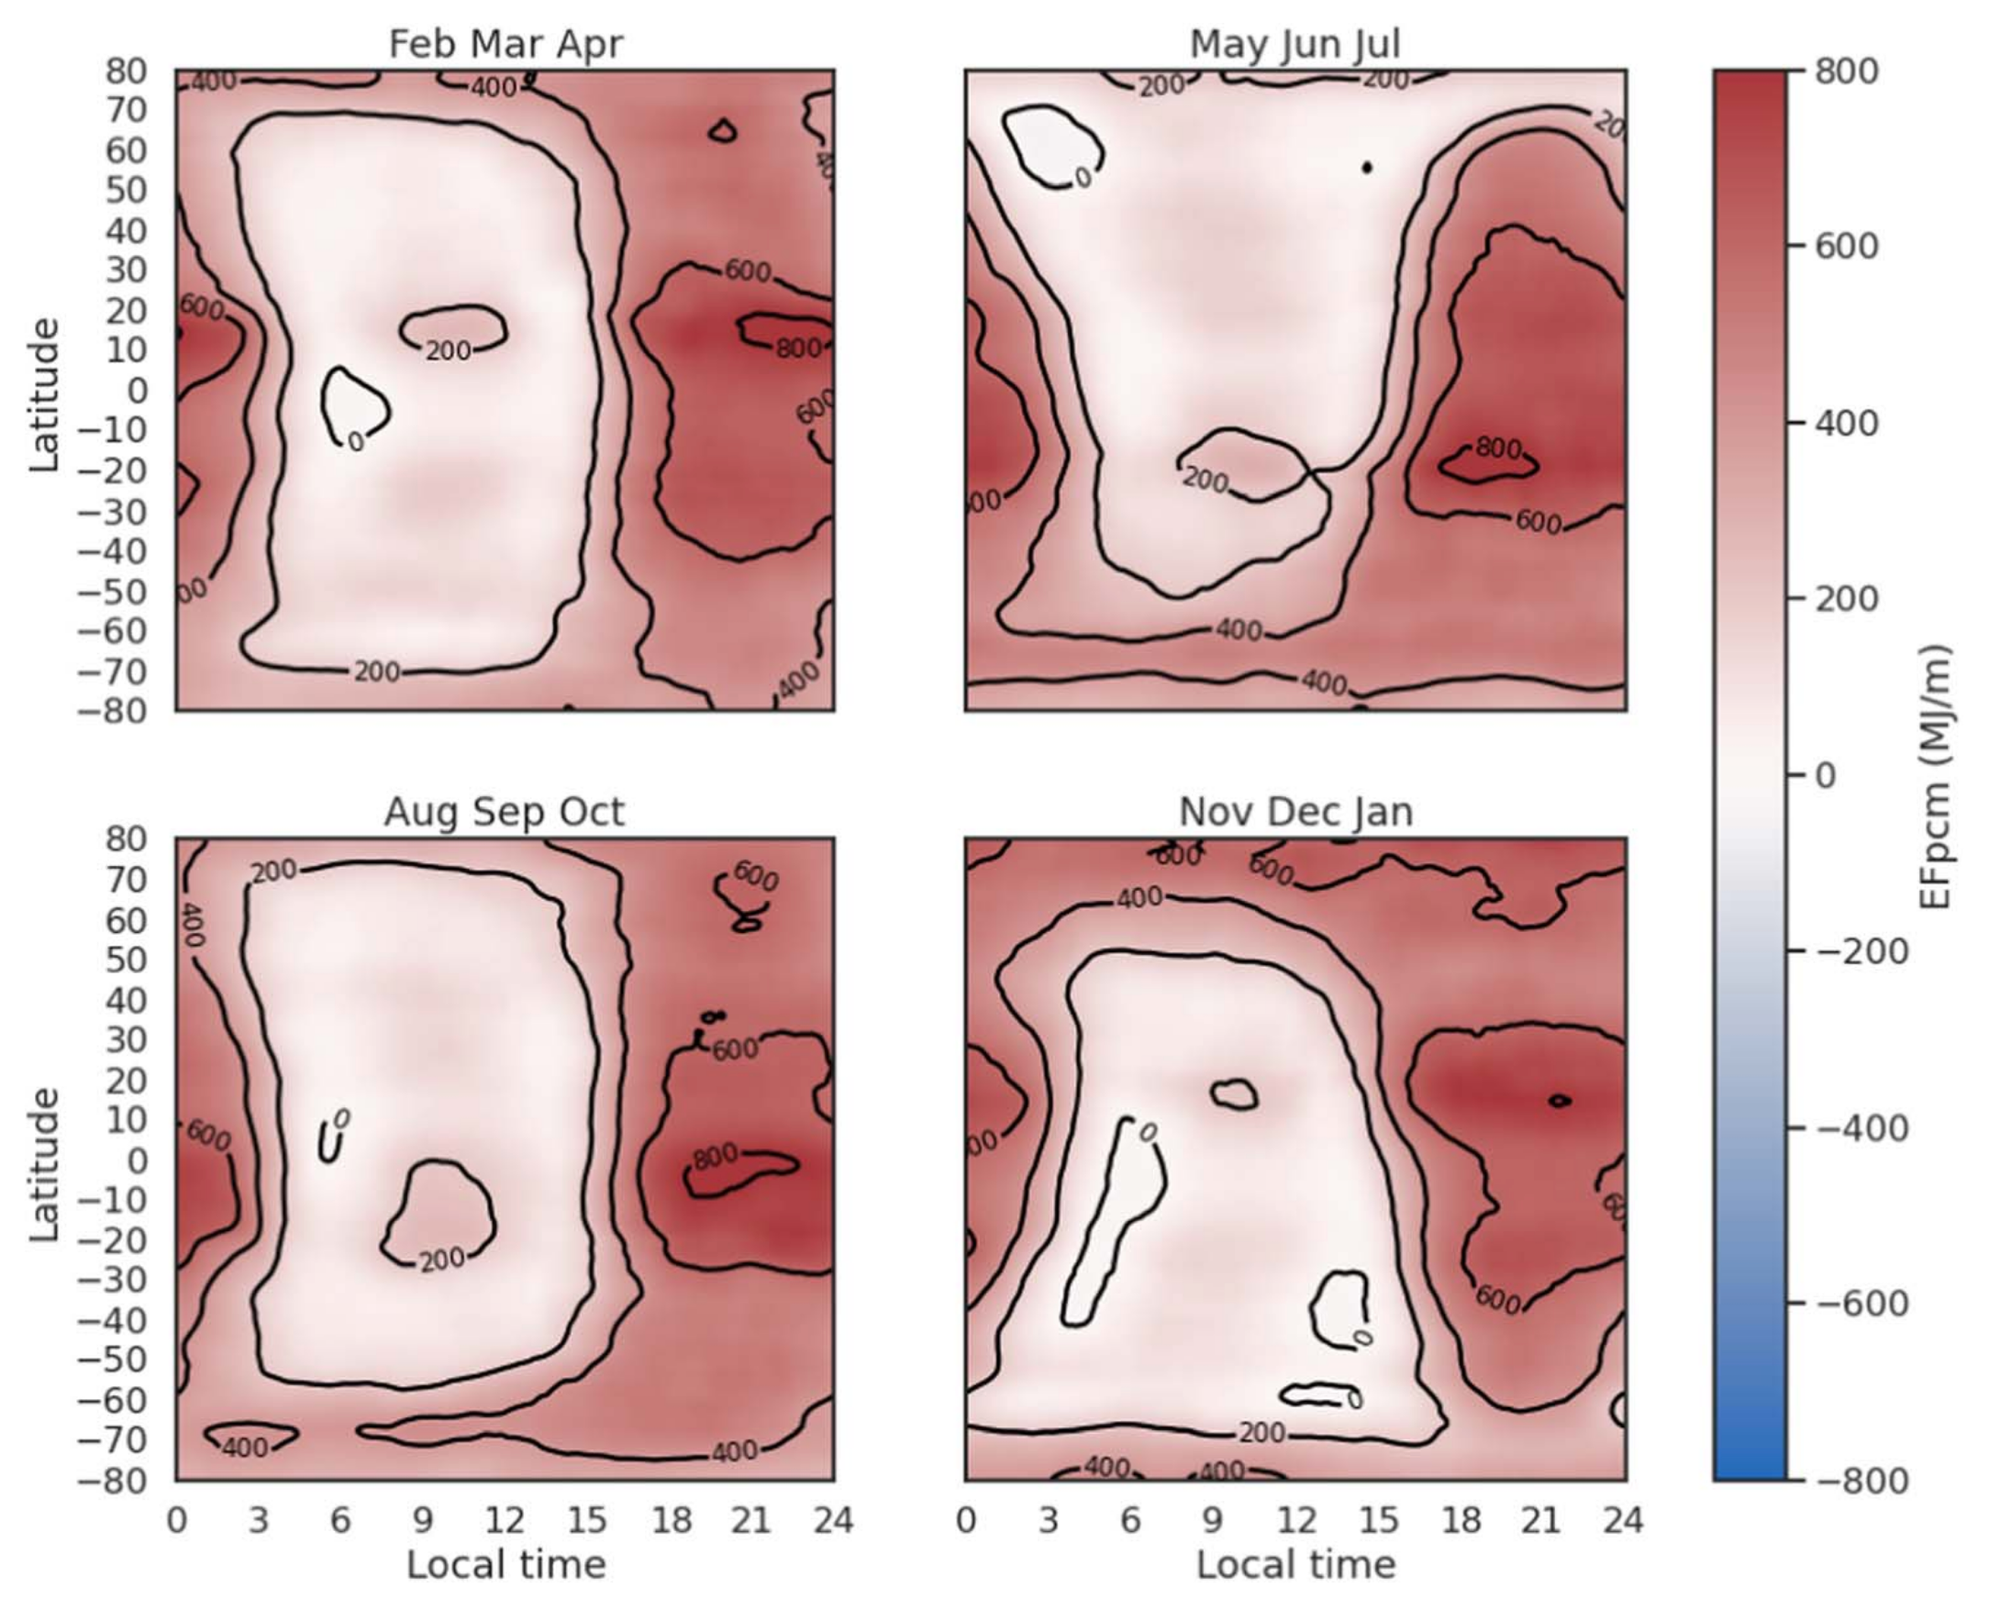
The underlying science comes from Platt et al. (2024), which simulated the hypothetical contrail energy forcing (EF) for a nominal contrail segment at any point across the globe. Their analysis covered every 0.5 degrees of latitude and longitude, three flight altitudes, and every three hours of the day.
To account for weather and model uncertainty, the researchers randomly sampled from weather ensembles and drew key model parameters from representative distributions. The results were then aggregated by season, latitude, and local time of day to build heatmaps showing the potential contrail EF per contrail-kilometer at any point on the globe.
To estimate a specific flight's contrail impact, the TIM traces a great-circle path between origin and destination airports, then integrates the contrail EF along that trajectory based on the scheduled departure and arrival times.
For each point in the trajectory, the EF is multiplied by the regional probability of persistent contrail formation as calculated in Teoh et al. 2024.
The integrated contrail EF is scaled by an efficacy factor of 0.42 to convert into an effective energy forcing (EEF), which is more closely related to the surface temperature response. The contrail EEF is compared to the CO2eq warming from the flight's emissions, conveyed as CO2eq energy forcing over a 100-year time horizon.[4]
The result is expressed as a contrail multiplier: the ratio of the flight's potential contrail warming (which occurs over hours) to its expected CO2eq warming (measured over a 100-year time horizon). A multiplier of 0.5 means the contrail impact is expected to be about half the CO2eq impact; a multiplier of 1.2 means the contrail impact is expected to exceed the CO2eq impact.
The TIM then classifies flights into three contrail impact categories based on this multiplier:
- Low: Contrail multiplier below 0.2 (contrail impact less than 20% of the CO2eq impact)
- Medium: Contrail multiplier between 0.2 and 1.0 (20–100% of the CO2eq impact)
- High: Contrail multiplier above 1.0 (contrail impact exceeds the CO2eq impact)
With this classification defined, we'll walk through some examples in Google Flights to show how to interpret CO2eq emission estimates alongside these new contrail classifications.
Contrail Classification in Google Flights
The Straightforward Choice
Let's take a look at a short hop within Europe, from London to Frankfurt. The screenshot below shows three nonstop British Airways flights that surfaced as the "Top flights" from Google Flights.
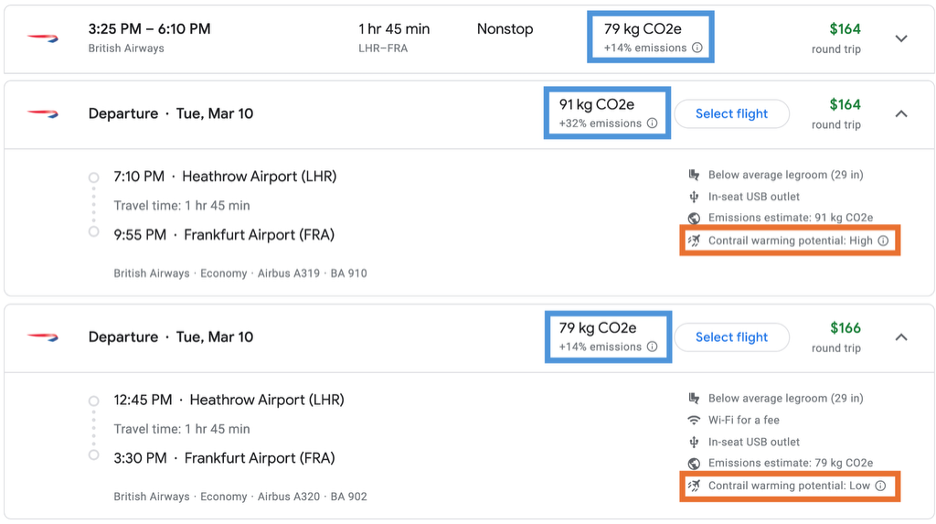
We’ve highlighted the GHG emissions with a blue box and the contrail classification with an orange box. The first option shows a GHG emissions estimate of 79 kg CO2eq, which does not include contrail warming. The contrail classification is visible if you expand the flight details by clicking on the arrow on the right–we've done this for the bottom two flights.
This layering of information is an intentional choice. We prioritize GHG emissions over contrail classifications because we're more certain about GHG warming than the contrail impact of a future flight.
Of the two expanded flights, one departs in the evening and the other in the afternoon. The afternoon flight has lower GHG emissions (79 vs. 91 kg CO2eq) and a lower classification for contrail warming potential (low vs. high), making it the easy choice for a climate-conscious traveler.
The choice is similarly easy if:
- The GHG emissions are similar (within ~6%)[5] and the contrail classifications are different.
- The contrail classifications are the same and the GHG emissions differ by more than ~6%.
You would clearly choose the flight with the lower GHG emissions or the lower contrail classification.
Prioritizing GHG Emissions over Contrails
Choosing between flights gets trickier when GHG estimates and contrail classifications nudge you towards different flights. The screenshot below shows a flight between Delhi and Bangkok from two different carriers.
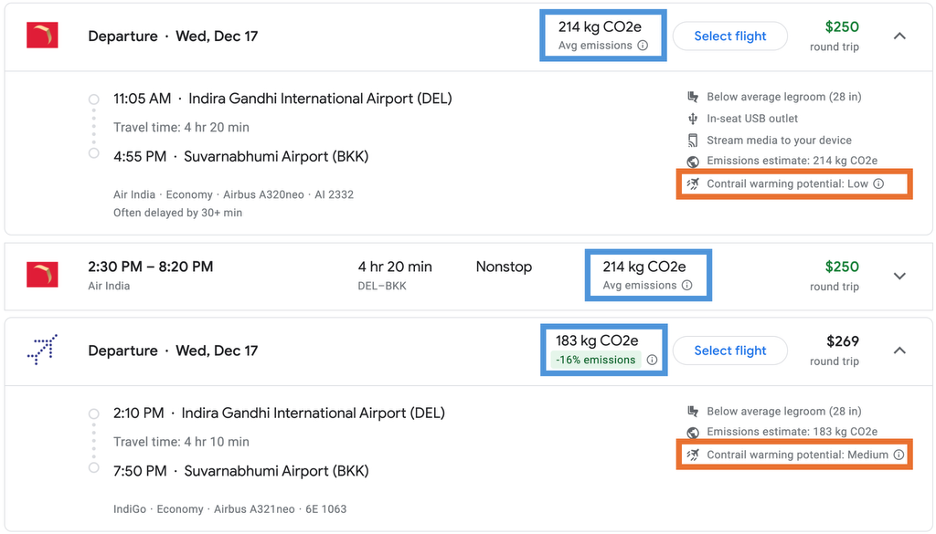
The options are a morning Air India flight (top) and an evening IndiGo flight (bottom). The morning flight produces about 16% more GHG emissions (214 vs. 183 kg CO2eq) but a lower contrail risk (low vs. medium). So which option should you choose?
In this situation, it makes sense to prioritize GHG emissions. Fuel burn can be estimated with high confidence, but we can't predict whether a flight far in the future will actually generate contrails. So the evening flight, with its lower GHG emissions, is the better choice.
In this particular case, the difference in GHG emissions comes from the choice of aircraft. The IndiGo A321neo aircraft (bottom) can fit more people, reducing its emissions per seat when compared to the smaller Air India A320neo (top).
Multi-Leg Journeys
So far we've looked at nonstop flights. Comparing connecting flights gets a little more complicated.
The next screenshot looks at flight options between São Paulo, Brazil and Sydney, Australia. Of the three options shown, we'll focus on the top and bottom ones with expanded flight details.
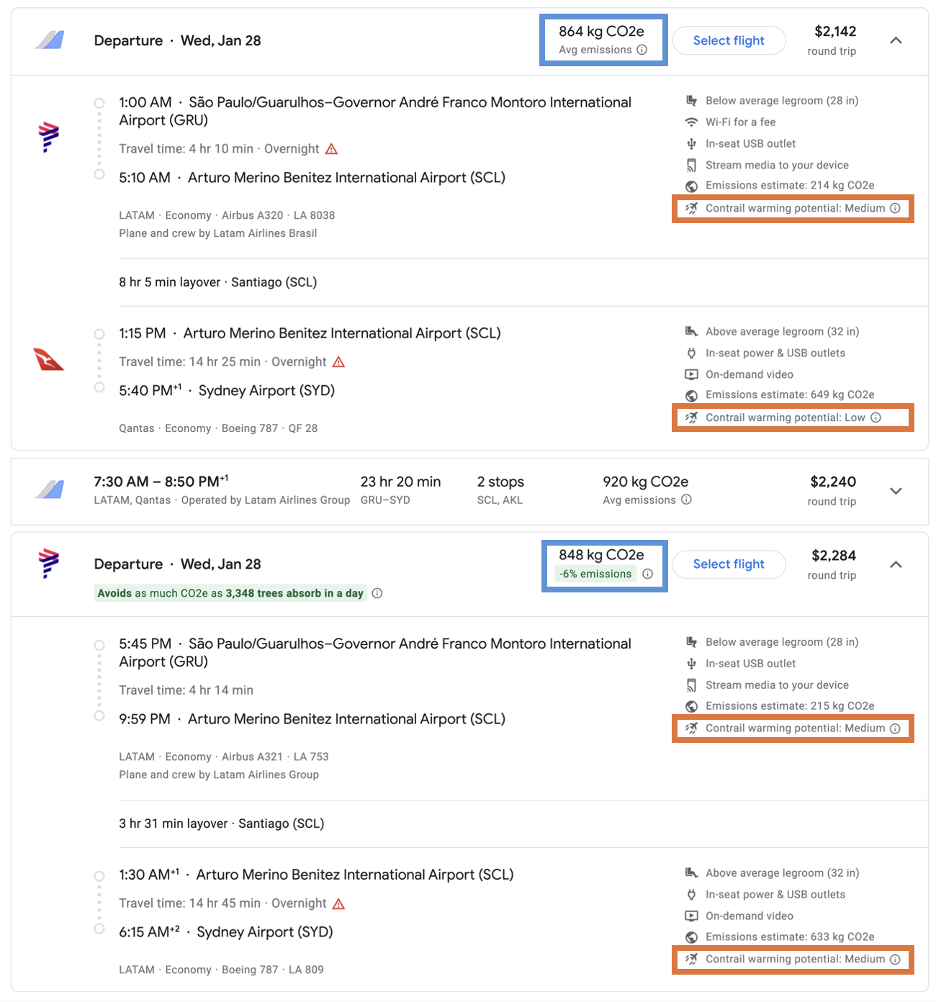
The top option has slightly higher total GHG emissions (864 kg CO2eq) with a medium contrail classification on the shorter leg of the journey and a low classification for the longer leg. The bottom option emits about 2% less GHG emissions (848 kg CO2eq), but both connecting flights have medium contrail classification.
This is a particularly tough choice because the GHG difference is quite small. We can follow the simple heuristic to prioritize GHG emissions and choose the bottom option.
A more advanced method is to aggregate the contrail classifications for the two legs into one classification for the entire itinerary. The online documentation provides a way to aggregate classifications for multi-leg journeys:
- Multiply each leg's GHG emissions by a contrail multiplier: 0.1 (low), 0.6 (medium), or 1.2 (high)
- Add the estimated contrail impact across both legs: (0.6 × 214 kg CO2eq) + (0.1 × 649 kg CO2eq) = 193 kg CO2eq
- Divide the total contrail impact by the total GHG emissions: 193 ÷ 864 = 0.22, indicating the expected contrail impact is 22% of GHG emissions
- Classify the whole itinerary: 22% puts the contrail in the medium classification
Running the same calculation for the bottom itinerary yields a contrail contribution of about 60% of total GHG emissions, which also falls in the medium category. Since both itineraries have the same contrail classification, the option with lower GHG emissions (bottom) is the better choice.
Conclusion
Contrail warming can be a significant part of a flight's total climate impact. Providing an estimate at booking time lets climate-conscious travelers make more informed choices.
The challenge is that we can't precisely predict contrail formation days or weeks in advance. The Travel Impact Model addresses this by using broad classifications rather than specific numbers–acknowledging the uncertainty while still providing actionable guidance.
The main takeaway: Use GHG emissions as your primary decision metric, and contrail classifications as a secondary tiebreaker. When both metrics point the same direction, the choice is easy. When they disagree, stick with the GHG numbers.
This is just the beginning. As airlines begin actively reducing their contrail impacts, the Travel Impact Model can evolve alongside them. With the model and governance in place, we'll work to ensure progress is reflected consistently across the ecosystem.
Footnotes
Read more background in "About the Travel Impact Model" ↩︎
The latest fuel burn model used in the Travel Impact Model is documented in "TIM base model selection and distance correction application" (2024) ↩︎
The methodology behind the contrail classifications is documented in these two technical briefs:
- Travel Impact Model Advisory Committee (2025) "Communicating contrail impacts"
- Travel Impact Model Advisory Committee (2025) "Update on communicating contrail impacts"
CO2eq is used here to denote the lifecycle emissions of the fuel, which includes emissions of greenhouse gases in the fuel production process. The CO2eq EF is calculated by multiplying the AGWP100,CO2 (Gaillot et al. 2023) by the number of seconds in a year, the surface area of the Earth, and the mass of CO2eq emitted by the flight. ↩︎
The median absolute error in the CO2 estimate for a flight is 6.3%. Google Flights also flags flights that deviate from the average emissions for a route by 6% or more. ↩︎