Observing Contrails (A Trifle Complicated)
This post describes the ways we can observe and measure contrails to evaluate contrail forecast models and improve our understanding of contrail effects.
There are many ways to see contrails. Each technique comes with its own benefits, biases and blind spots. This post outlines the different techniques we have to observe and measure contrails, the strengths and weaknesses of these techniques, and how we can use them to evaluate models and improve our understanding.
Persistent contrails form in very specific conditions: cold, humid air at typical cruise altitudes, where ice-supersaturated regions (ISSRs) can persist for hours. But these regions are invisible to the naked eye, transient, and somewhat rare, only occurring in ~5-10% of airspace on average. Measuring persistent contrail regions directly—and validating whether models predict them correctly—is one of the hardest problems in contrail science.
No single observation method provides the full picture. Some techniques are highly accurate, but their coverage is extremely sparse. Other data sources give us a near-global picture, but their resolution is too coarse to accurately identify contrail regions consistently. The trick is to layer these different observations to yield a product that is greater than the sum of its parts.
The five families of measurements
We can roughly organize contrail relevant observations into five families:
- Humidity measurements (Point measurements)
- Cameras (Visible/IR imagery)
- Radar systems (LiDAR and Cloud Profiling Radar)
- Heat detectors (Broadband radiometers)
- Reanalysis Data (Data assimilation into weather models)
Humidity measurements, cameras, and reanalysis data are useful for evaluating contrail forecast regions and estimating contrail warming. Radar systems and heat detectors are valuable for improving contrail process models and (potentially) measuring contrail warming directly.
The next sections look at each family in more detail.
This post has lots of complicated names and acronyms. We built a Contrail Glossary to consolidate the jargon and annotate the post. Hover (or click) on terms with the dotted underlines (e.g., PCR) to get more information.
1. Humidity measurements
Humidity measurements are the most direct and accurate data source for capturing persistent contrail regions. They capture temperature and humidity at specific places and times, usually along a vertical profile or horizontal flight path.
These point measurements define where contrails can form and persist. They still require models to determine if a contrail will form (typically using the Schmidt-Appelmann Criterion, SAC) and persist (in an ice-supersaturated region, ISSR). See Contrail Regions 101 for more background on how persistent contrail regions are defined.
There are a few common platforms for measuring the humidity in the atmosphere: Radiosondes, On-board aircraft humidity sensors, and Satellite hyperspectral sounders.
Radiosondes
Weather balloons—or radiosondes[1]—are the main source of high-resolution vertical profiles through the atmosphere. They measure (amongst other meteorological data) temperature, humidity, and wind as they ascend, giving us a high-resolution look at the atmosphere's structure. However, not all radiosonde data sources are created equal:
- GRUAN (the Global Reference Upper Air Network) provides the gold standard of accuracy for radiosondes, targeting relative humidity to within ±2% and temperature to within ±0.1°C. Profiles are published with vertical resolutions of 5-10 meters. But there are only ~30 GRUAN sites worldwide, typically each launching 2-4 times a day (at most).
- MADIS Radiosondes (NOAA's Meteorological Assimilation Data Ingest System) expands this to roughly 200 radiosonde stations globally. Data are available almost in real time, but require calibration to correct for known sensor biases (e.g., dry biases in the older RS92 sondes). The published vertical resolution of the profile, especially outside the USA, is also substantially lower than GRUAN.
- IGRA (NOAA's Integrated Global Radiosonde Archive) publishes a more complete dataset of around ~800 stations globally, but at much lower vertical resolution.[2] A subset of data has humidity sensors accurate enough to give us sparse information about the odd point within a contrail layer (e.g. Vaisala RS92s). But IGRA data is substantially down-sampled from the original profile, so it often requires significant interpolation of the data to estimate where the edge of that layer might be.
Radiosondes are incredibly useful for detailed vertical validation, but give very sparse coverage. Even taken together, they only sample a few dozen atmospheric columns per hour across the planet.

It's worth mentioning there's a start-up, WindBorne Systems, that has developed and launched a new type of long-duration radiosonde. Instead of bursting after an hour or two like traditional weather balloons, WindBorne's sondes can drift for weeks, riding the wind around the globe while actively ascending and descending through the atmosphere to take repeated profiles. Each balloon is roughly the size of a backpack and can transmit over thousands of kilometers, including over oceans where traditional radiosonde coverage is very low.
The technology is still maturing. Early deployments show promise for extending humidity observations into data-sparse regions, but there's no public information on the humidity sensor accuracy.
On-board aircraft humidity sensors
A handful of aircraft are equipped with sensors capable of measuring humidity and temperature directly at cruise altitude.
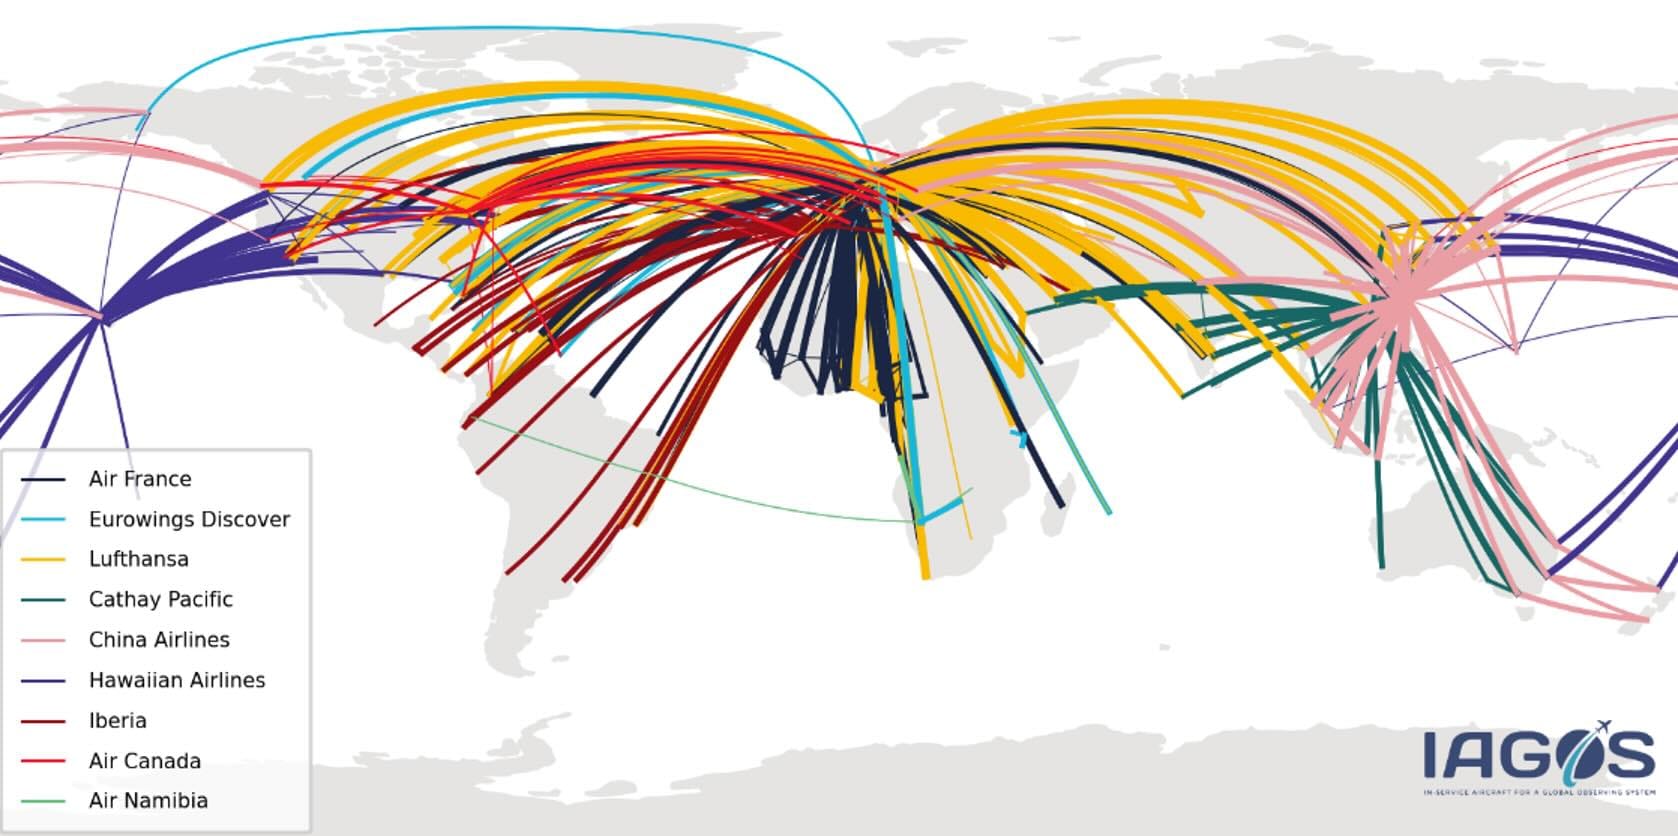
IAGOS is a network of about ten commercial aircraft (Airbus A330, A340 & A350s), each equipped with sensors measuring water vapor, ozone, and temperature along its intercontinental routes. These data are highly accurate[3] and represent true in-situ measurements at flight levels—but number of aircraft is tiny, so like radiosondes, actual coverage of the entire airspace aircraft fly through is very limited.
AMDAR is another network of commercial aircraft that report meteorological conditions. Approximately 100 aircraft (mostly in North America) are fitted with water vapor sensors, but their humidity sensors (WVSS-II) have lower resolution. This means AMDAR measurements won't accurately measure ice super-saturation consistently at the very cold temperatures found at the cruise altitudes.[4] Even so, they accurately read sub-saturated states at moderate temperatures, so they can provide valuable large-scale statistics, particularly given coverage from radiosondes and IAGOS is limited.
AMDAR monitors and reports temperature on a high proportion of commercial aircraft at relatively high accuracy. This is one of the reasons weather models predict temperatures at cruise altitudes with much higher accuracy than humidity.
Satellite hyperspectral sounders
There's another source of vertical humidity and temperature profiles: satellite-based hyperspectral sounders, such as AIRS, IASI and CrIS. These instruments sit on polar-orbiting satellites, and use the thermal infrared spectrum (and/or microwaves) to infer temperature and water-vapor content through a column of atmosphere. Each footprint (typically around 13 km across) provides a vertical profile of temperature and humidity, much like a remote radiosonde ascent. Over successive orbits, the satellite builds a global mosaic of these profiles every 12–24 hours.
In theory, this broad coverage makes hyperspectral sounders a powerful complement to the sparse global radiosonde network. In practice, however, their accuracy is limited. While temperature retrievals are excellent (within about ±1 K even near cruise altitudes), humidity estimates at typical aircraft cruise altitudes are too uncertain to determine ice-supersaturation (±20–30% relative humidity). The effective vertical resolution is coarse (1–2 km, or 2–3 flight levels), so narrow supersaturated layers tend to be smeared out or missed entirely.

2. Cameras
The next family of observations see contrails directly, using visible (or often infrared) imagery from satellites, ground cameras, or even the aircraft themselves.
In the past, researchers identified linear contrails using classical image processing algorithms looking for line-shaped patterns. More recently, machine learning has become standard for detecting contrails in satellite and ground camera images. These linear contrail patterns can be matched to flight paths, typically using aircraft position (ADS-B) data, and adjusted for wind, which causes the linear contrails to drift from their original formation locations. Attributing contrails to flight paths can tell us the altitude of the linear contrail, which is otherwise difficult to determine from purely 2D images.
Cameras can detect contrails directly, rather than inferring them from models like the Schmidt-Appelmann Criterion (SAC). However, they only tell us about regions that aircraft fly through, so they can't tell us if a contrail would have formed in some other region. And contrail detection algorithms are imperfect, so the absence of a contrail isn't reliable evidence. The system may have missed it, or failed to attribute a visible contrail to its source flight.
We collect imagery from a few different sources: Geostationary (GEO) satellites, Low Earth Orbit (LEO) satellites, ground cameras, and aircraft tail cameras.
Imagers on Geostationary satellites
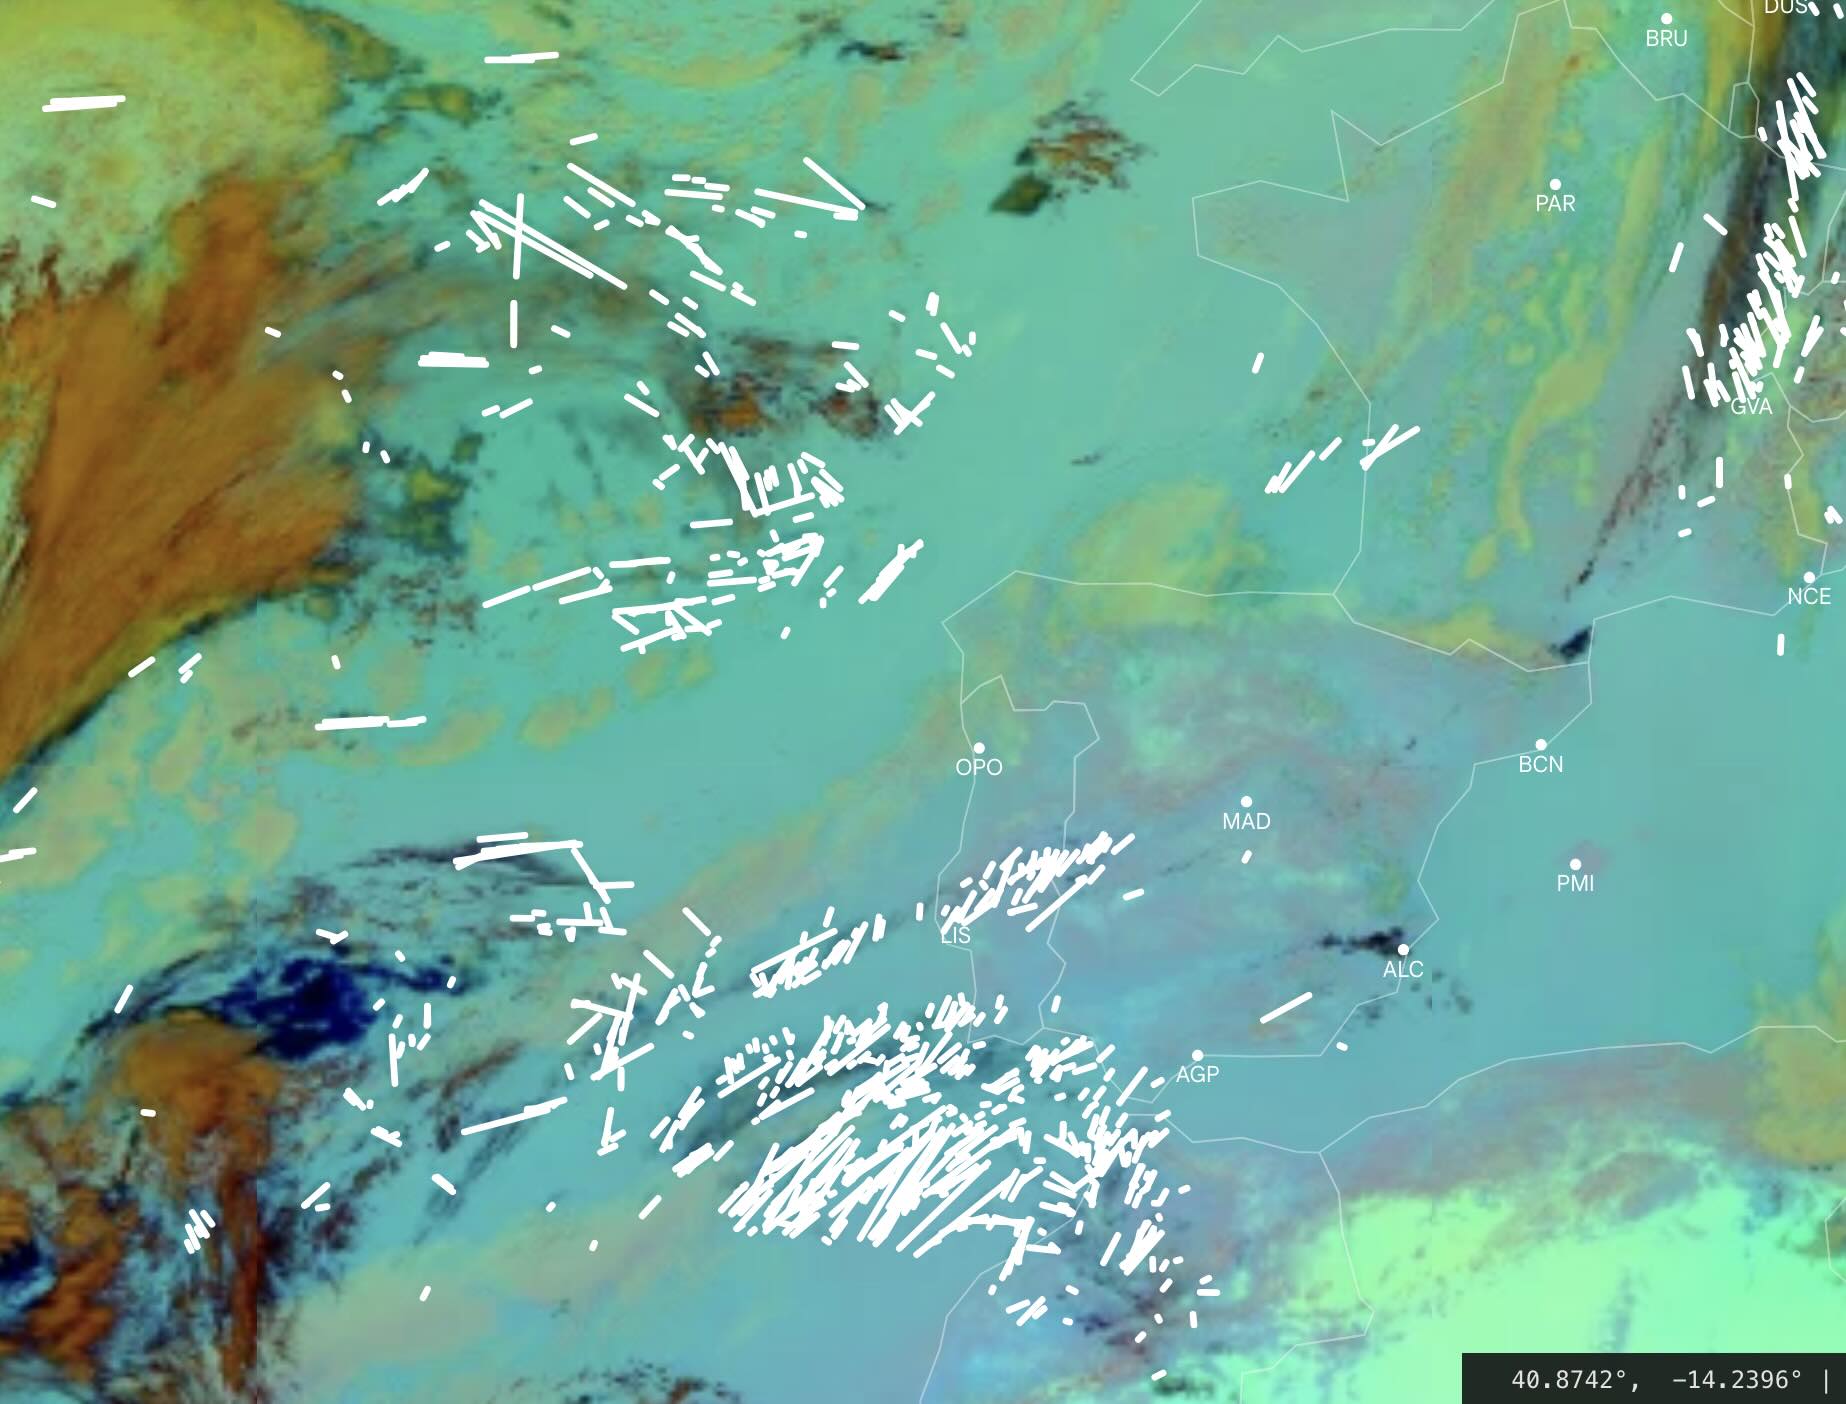
Geostationary satellites are currently the workhorses of contrail detection. Satellites such as the US's GOES, the EU's Meteosat, and Japan's Himawari sit in fixed orbits, continuously imaging the same portion of the Earth every 10–15 minutes. Together these imagers provide a view of almost the whole globe in near real-time. But imaging at this scale has some practical limitations.
The pixel resolution of these cameras is ~1-2 km at nadir in the thermal bands we want to image.[5] This means that the cameras can only see contrails if they persist long enough and grow large enough to be many kilometers across (~15-30 minutes). The resolution gets worse as you head towards the poles, so contrails need to be even larger to resolve. If the contrail spreads into a non-linear shape before it's observable, existing algorithms can't distinguish it from other natural cirrus. Some weather conditions (particularly thick natural cloud cover) make it hard to resolve linear contrails after any amount of time.
When we're able to detect a linear contrail, we often can't definitively attribute that contrail to one aircraft. This can happen because wind data isn't accurate enough to link a contrail to a specific aircraft, or because flight data (ADS-B) is missing (e.g., without satellite ADS-B, or military flights). Without being able to attribute a contrail to a single aircraft, we can't work out the altitude that the contrail formed at, or even exactly where it formed before it drifted on the wind.[6]
Despite these limitations,[7] geostationary satellites are well-suited to capturing broad, clear-sky contrail outbreaks that have significant radiative impacts. Since stronger, longer-lasting contrails are both easier to detect at coarser resolutions and arguably responsible for the bulk of contrail warming, geostationary data may capture a disproportionately large share of the climatically significant events—even if we know they can’t see initial contrail formation and young contrails before they grow.
Imagers on Low-Earth-orbit (LEO) satellites
LEO satellites orbit much closer to the Earth, allowing their sensors to gain finer spatial detail than geostationary satellites. However, they're constantly moving overhead, passing over the same patch of Earth at most twice a day, so they only capture snapshots of contrails in transit.
LEO imagery can have very high resolution in the visible and thermal spectrum (5-100m). Missions such as Landsat and Sentinel provide high-resolution visible imagery with some thermal bands, while missions such as MODIS (Aqua & Terra) historically provided global views of cirrus and contrail coverage with high spectral density. New instruments such as VIIRS (on Suomi NPP, S-NPP, and NOAA-20) and EarthCARE have imagers with high spatial resolution and specific spectral bands designed to distinguish ice clouds from water clouds.
EarthCARE colocates a number of instruments on-board the same satellite: its imager is colocated with LiDAR (ATLID), Cloud Profiling Radar (CPR), and a Broad-Band Radiometer (BBR). As discussed in Radar systems, LiDAR and CPR can tell us the height and thickness of a contrail detected in an image, whereas the radiometer can help determine the actual heat trapped by cirrus formations (see Heat detectors).
LEO imagery formed the basis for much of the early work on contrail detection (Mannstein et al. 1999, Vasquez-Navarro et al. 2010). On-going work attempts to use LEO imagery to supplement or help evaluate the capabilities of geostationary contrail detections.
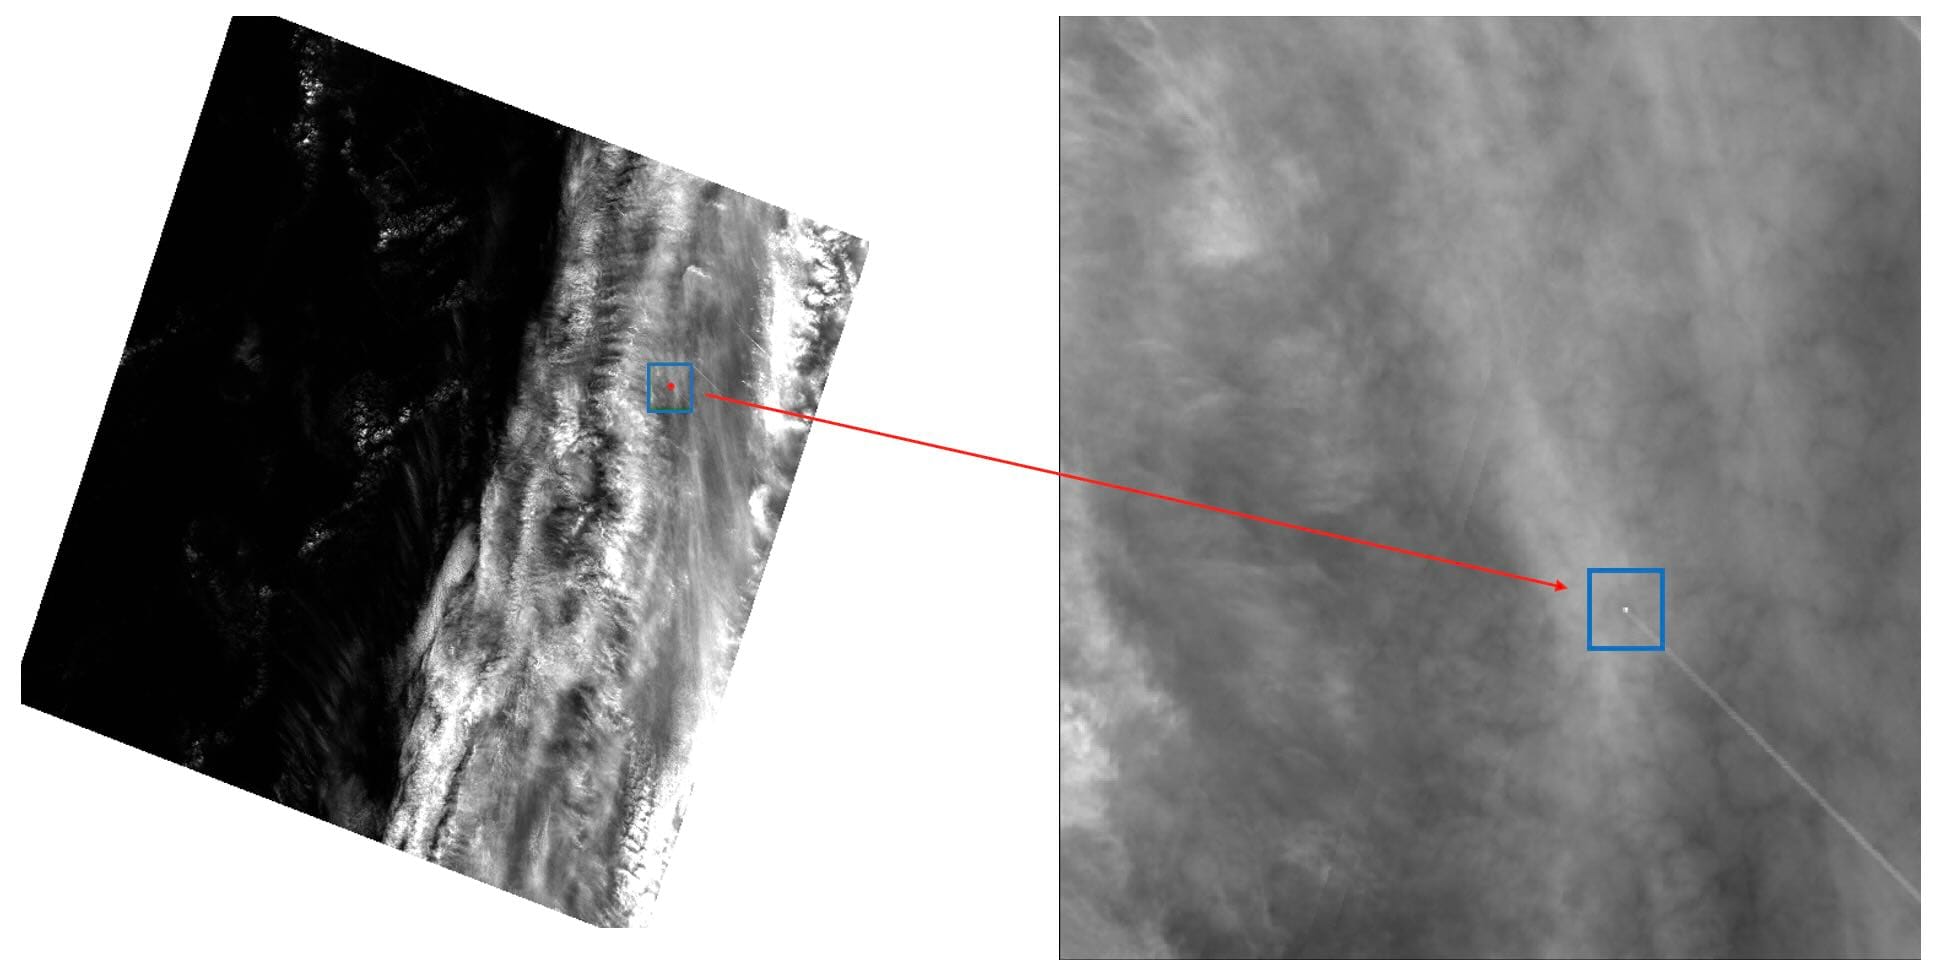
The primary advantage of LEO over GEO is the spatial detail. While a Geostationary pixel might be 2 km wide, a LEO instrument like Landsat can resolve features down to 30 m, meaning we can even see aircraft themselves in the images from some LEOs. This allows us to see contrails just seconds after they form, before they have spread enough to be visible in imagery from geostationary satellite.
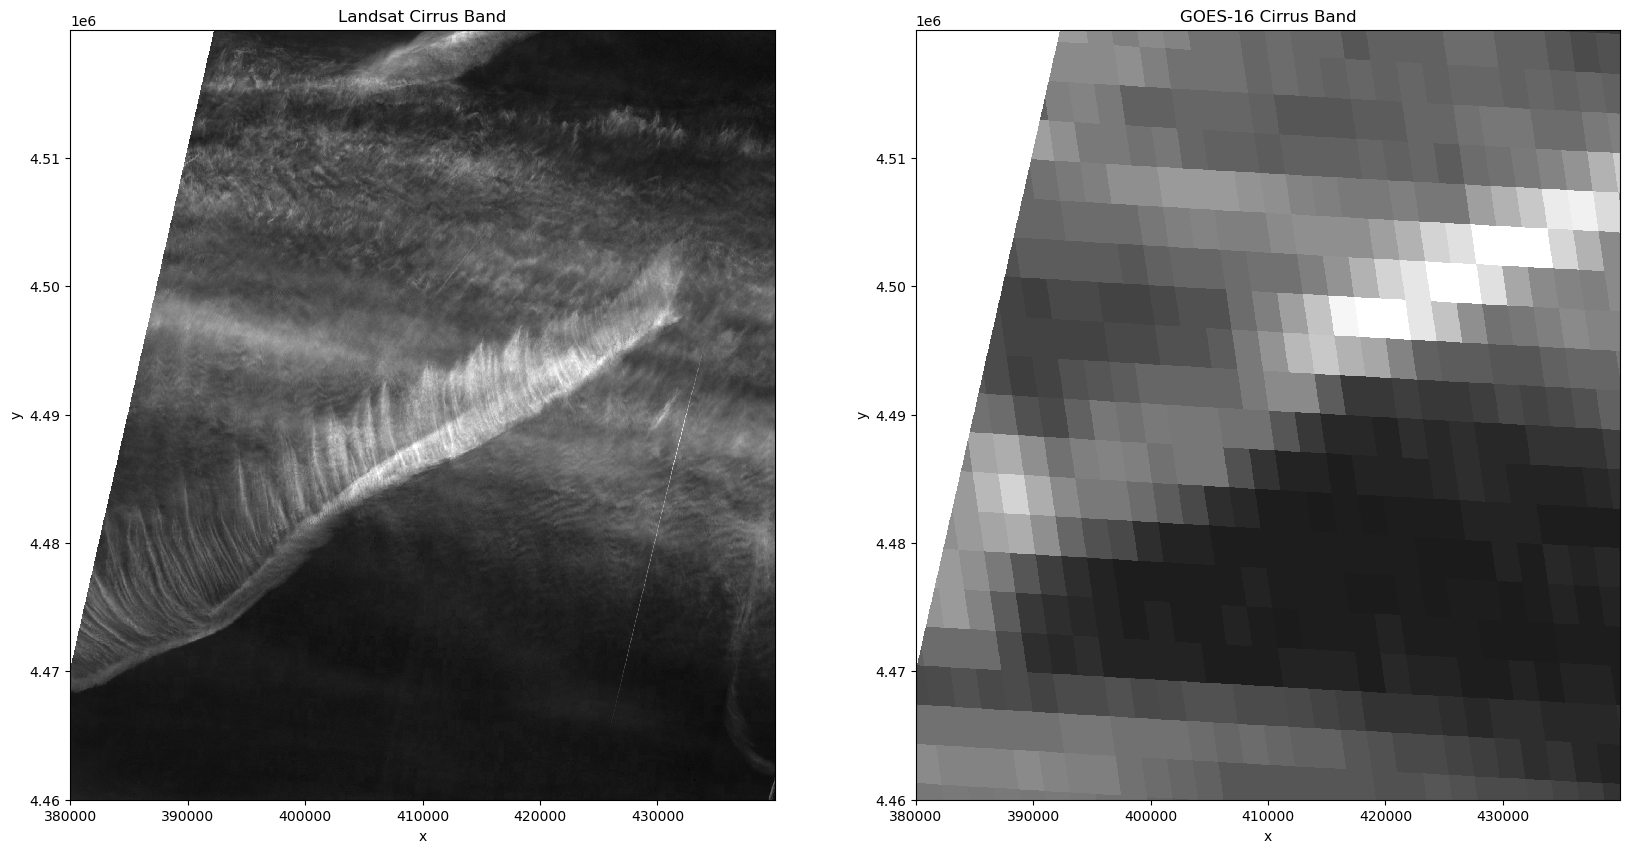
However, LEO imagery suffers from a "revisit" problem. A single LEO satellite takes very detailed images of the strip (the swath) it passes over, but only once or twice a day for any given location. In contrast, a geostationary satellite takes relatively grainy images, but of the same very large area, every 10-15 minutes. This makes it hard for individual LEO satellites to detect and attribute persistent contrails.
To realize the benefit of high resolution LEO satellites with the coverage of geostationary satellites, we could build a large constellation of hundreds of LEO satellites to cover every area of airspace every ~10 minutes. There are constellations of LEOs in development, such as FireSat (developed for quick wildfire detection), that will offer continuous global infrared coverage that could be used for contrail monitoring.
Ground-based sky cameras
All-sky cameras can continuously image the sky from the ground. Ground cameras have similar (or better) spatial resolution to LEO satellites, but full temporal coverage. Because they're constantly monitoring, they can actually see contrails being formed as the aircraft passes overhead, and watch, minute by minute, as that linear contrail drifts and grows.
The Global Meteor Network (GMN) operates a crowd-sourced network of ~1000 sky-facing cameras globally to monitor meteor strikes. Contrails.org, Google, and others are currently working with researchers at GMN to implement contrail detection models onto GMN cameras.
Other research teams have developed contrail observatory systems to examine the potential of ground cameras, including EUROCONTROL, Reuniwatt, and Miratlas.
One limitation of these systems is that the reach is limited to airspace over land, missing a significant proportion of contrails in oceanic airspace. If land-based sky cameras prove to be a cost-effective way to monitor contrails, there are many ideas on how to extend coverage to oceanic airspace, such as mounting cameras on ships; floating, drifting buoys; or on permanent weather buoys. Another limitation is that low cloud cover can obscure the visibility of higher altitude contrail-cirrus from the ground.
Aircraft tail cameras
Some widebody (twin-aisle) aircraft, particularly the Airbus A350 and Boeing 777, carry tail-mounted cameras that could record contrails as they form.
These could serve as research tools, verifying initial contrail formation in situ to compare against other observations. However, today, most such data remains uncollected and proprietary.
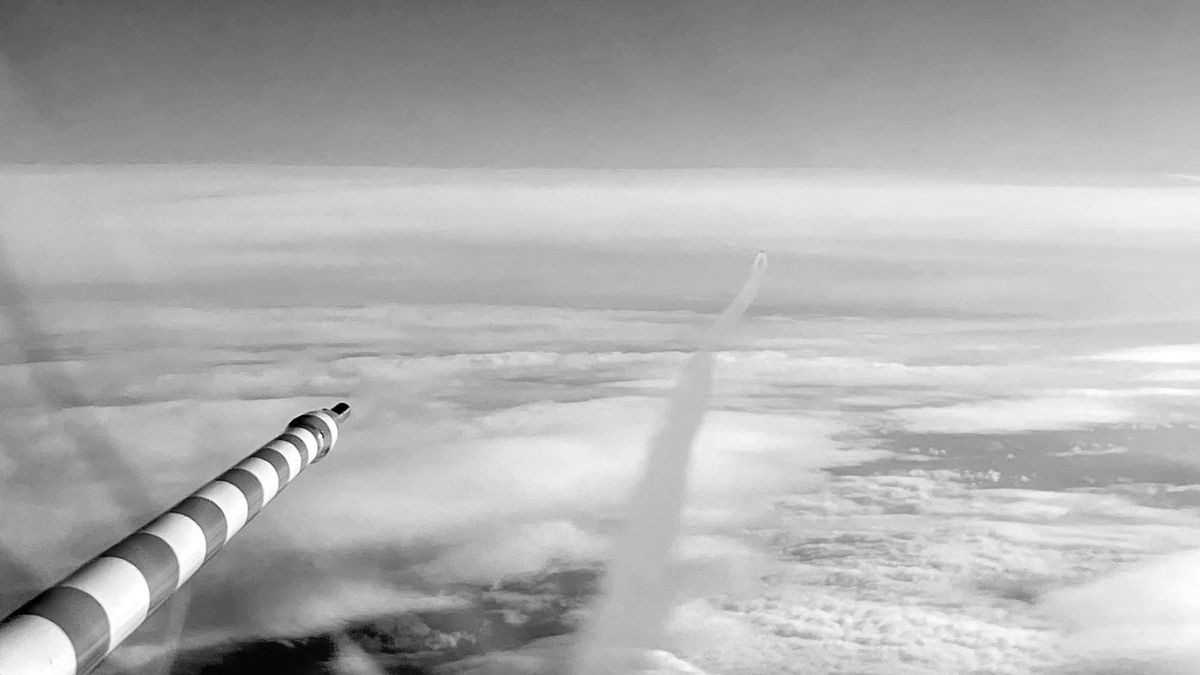
Contrails visible from the tail camera of a Virgin Atlantic A350-1000, halfway across the North Atlantic en route from London Heathrow to New York (JFK) on 20th September 2025,[8] as captured from the in-seat entertainment system by our own Eóghain Mitchison.[9] You can see quite clearly a contrail being formed on the engine on the left, with the contrail from the other engine being less visible.
3. Radar systems
Radar, in its original form, shoots out radio waves and detects the waves that bounce back from objects. "LiDAR" (effectively, radar with light waves instead of radio waves) and Cloud Profiling Radar (CPR) can be used to inspect the properties of clouds and contrail formations.
LiDAR instruments are both ground-based (e.g., Raman LiDARs used at the DOE's Atmospheric Radiation Measurement, ARM, sites) and satellite based (e.g., EarthCARE). The shorter wavelengths of light allow LiDAR to detect ice crystal number, size and location in a contrail formation, in one vertical line at any one time. This makes LiDAR extremely useful for examining contrail formation and broadly how ice crystals in contrails form and grow.
LiDAR has also been useful to validate and improve observations (e.g., from cameras) as we can look at contrails drifting over the rare LiDAR measurement. The LiDAR is able to precisely determine the altitude of the contrail, as well as the particle size and number.
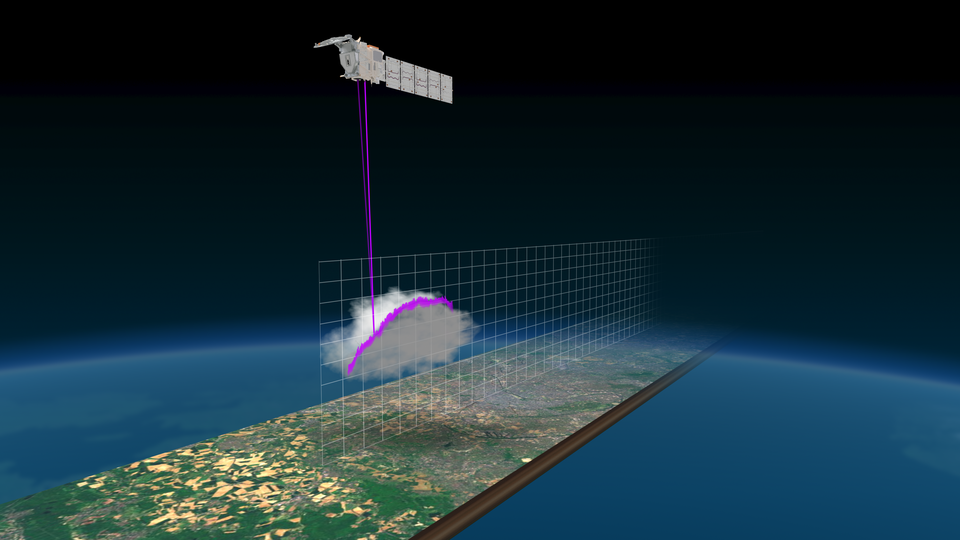
EarthCARE LiDAR schematic. (Source: ESA, ESA Standard License)
Cloud Profiling Radar (CPR) is typically fitted to satellites and uses radio waves. As such, it doesn't pick up individual ice particles in a cloud or contrail, but rather picks up the entire formation. It's able to determine the size, thickness and altitude of larger formations, able to penetrate deep into thicker cloud formations. LiDAR unfortunately gets blocked by the first set of ice crystals it hits.
CPR is useful for looking at changes in total cirrus coverage, and LiDAR is useful for testing contrail formation and evolution models. But both measurements have trouble distinguishing between contrails and natural cirrus without other observations to compare with. Both sources can't generally see where contrails formed originally, so they aren't particularly useful for evaluating contrail forecasts.
4. Heat detectors
Beyond detecting linear contrail formation and evolution, we're making substantial progress at directly estimating the net warming of contrail formations using satellites. Broadband radiometers, such as those found on CERES, can be used to detect the total amount of longwave radiation (i.e., heat) leaving the Earth at around a 1 km grid resolution. From this perspective, warming contrails look cold from satellite-based radiometers, as the contrails trap outgoing heat radiating from Earth and blocking the heat from the satellite. With additional modeling to estimate the outgoing radiation in the absence of the contrail formation, it's possible to back out the radiative forcing due to contrails in a given region.
Accurate broadband radiometers are generally on moving LEO satellites, so Google recently published a model that maps results from these LEO radiometers onto information from geostationary satellite images using Machine Learning techniques. This allows geostationary satellites to estimate contrail warming across all of their images, all the time.[10]
This approach is still relatively new, but could allow us to directly monitor contrail warming over a region. The warming estimates currently require large amounts of data and so do not determine the contrail warming from one particular aircraft, but may be able to estimate the radiative forcing of subgroups of aircrafts or regions (e.g. Flight Information Regions, FIRs).
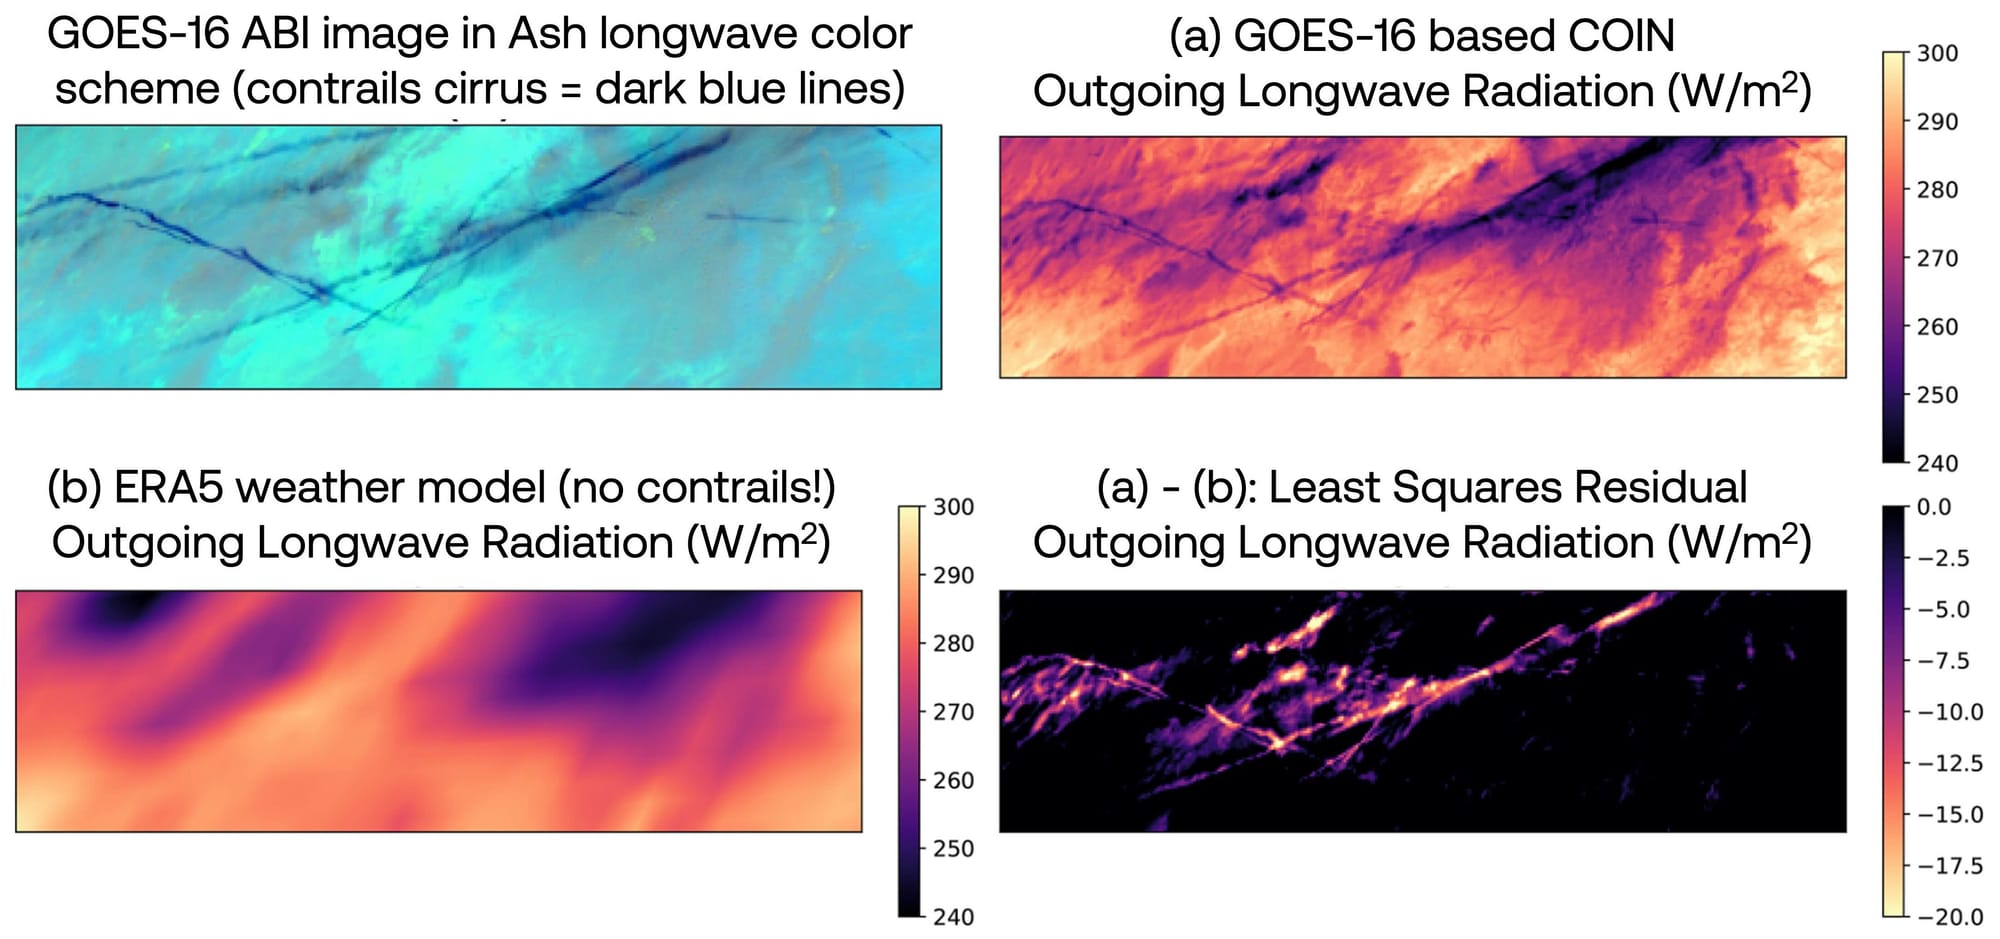
Google's empirical radiative forcing measurement scheme. COIN (Collocated Irradiance Network) uses GOES-16 ABI imagery to estimate Outgoing Longwave Radiation (OLR) in a contrail outbreak scene on 18 July 2019 14:20 UTC over southwestern USA. COIN is trained on collocation of GOES imagery and measurements from CERES bolometers onboard Aqua and Terra satellites. ERA5 reanalysis data does not contain models or observations of contrails, and this is subtracted as the background to the COIN image to yield an estimate of the longwave radiation trapped by contrails. Modified from source: Sondabend et al. (2026)
5. Reanalysis products
Reanalysis datasets don't observe contrails directly. Instead, they use models of the atmosphere that assimilate observations from across the world to reconstruct the best possible estimate of past weather conditions.
Products such as ERA5, MERRA-2, and JRA-55 provide global coverage and high temporal resolution. They're excellent for temperature, wind, and pressure fields, but humidity at cruise altitudes (the key variable for contrails) remains uncertain because the observations feeding the models are sparse and noisy. No contrail-relevant observations (like contrail detection from satellites and ground-cameras) are assimilated into these reanalysis models at present.
We can still use reanalysis data as inputs to contrail models (e.g., CoCiP) to estimate when and where contrails should have formed and how they evolved,[11] but they should not be considered to be a source of ground-truth.
Accuracy vs. coverage: Finding the balance
We've found if we plot coverage of a given data source (i.e., what proportion of the Earth and what proportion of the day the data covers) against accuracy (i.e., what proportion of contrail regions the data successfully locates within its coverage), each observation source sits somewhere between (1) highly accurate, but sparse data, and (2) high-coverage but less accurate data.
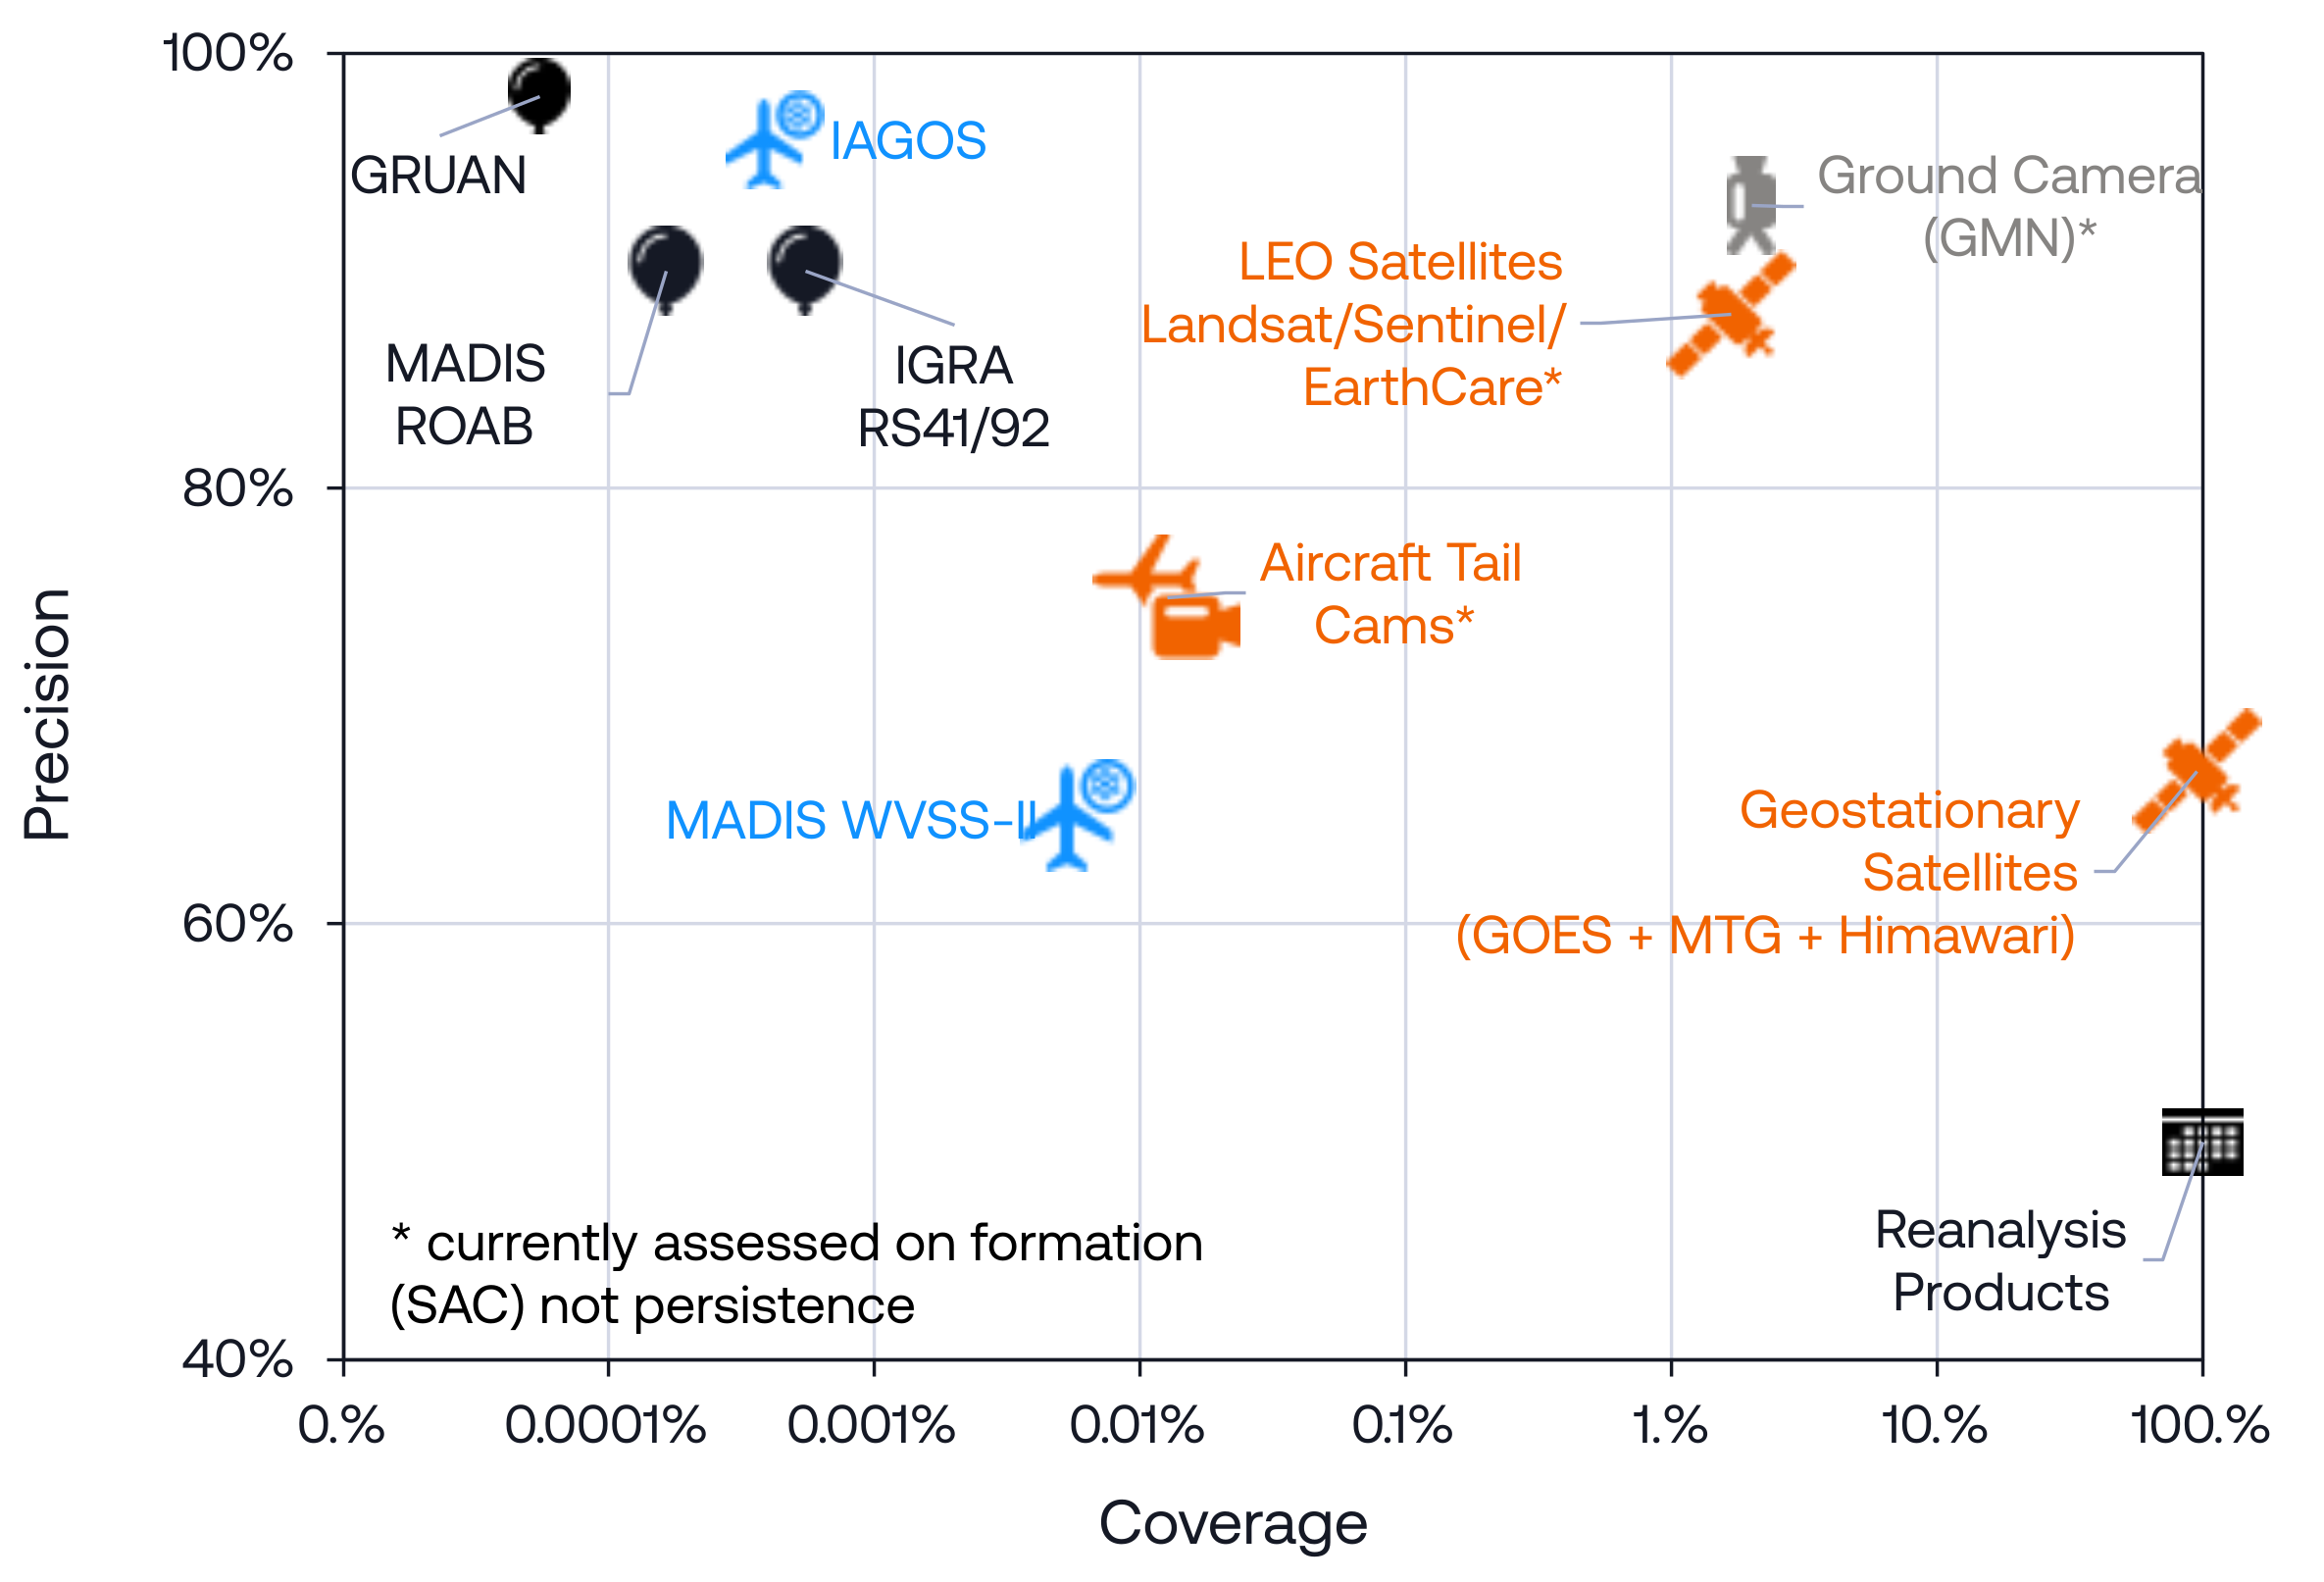
Approximate precision versus global coverage (volume of global cruise altitudes covered) of different contrail observation systems.[12]
The figure shows a clear trend where accuracy drops as coverage grows.
Radiosondes and in-situ aircraft sensors offer precise but rare data points. Reanalyses see everything, but only in broad strokes. Satellites sit somewhere in the middle as a compromise–perhaps explaining why geostationary satellites are used for verification in most contrail avoidance trials.
To gain the most complete picture, we must layer different observations.
The Observation Trifle
To properly benchmark contrail forecasts, no single observation can be our ground truth. Every technique is incomplete—so we have to layer them.
Since almost half of our group is in the UK, we call this the Observation Trifle.[13] Each layer adds something essential:
- The accurate but sparse radiosonde and aircraft humidity data form a strong, sturdy base. (The sponge fingers)
- The broad satellite imagery and camera imagery fills in the gaps and provides the heft as dense layers. (The jelly and custard)
- And the reanalysis ties the whole system together into a coherent picture. (The whipped cream)
Used together, the combination is greater than the sum of its parts.
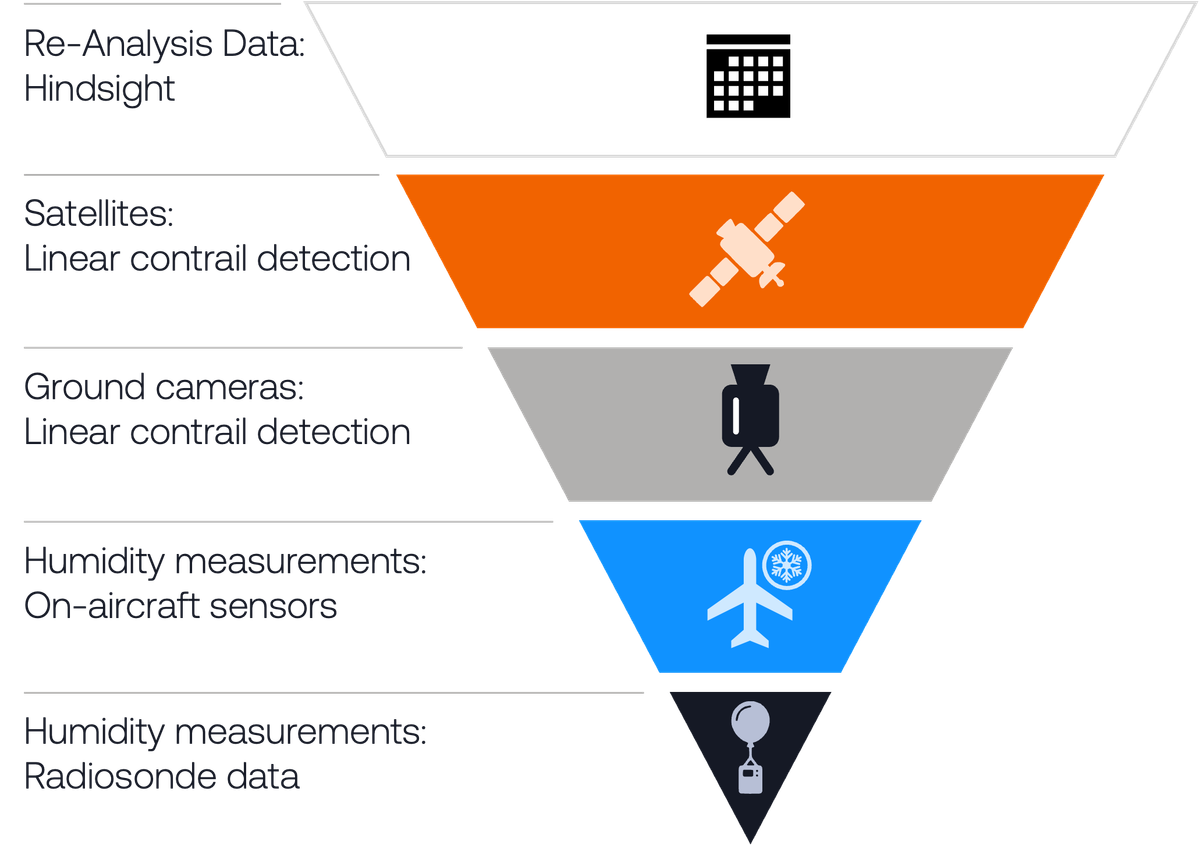
The Observation Trifle[13:1] for contrail region observations.
Towards ContrailBench
We will be releasing a new framework for evaluating contrail forecasts against observations, termed ContrailBench. We'll be using this layered approach to assess and benchmark contrail forecast performance.
Starting with the most accurate but sparse data (GRUAN and IAGOS) to anchor persistent contrail region detection at cruise levels, we'll then overlay satellite and camera detections to map where persistent contrails were actually seen. This will allow us to quantify, grid cell by grid cell, how well a forecast predicted persistent contrail regions.
Looking ahead
Contrail observations are evolving fast.
New humidity sensors, improved techniques to leverage information from more and more satellites and use of low-cost camera networks are all expanding our ability to monitor and understand contrails.
The future isn't a single perfect observation: it's the combination of many imperfect ones.
Footnotes
Radiosondes are sometimes referred to as “rawinsonde”, denoting a radiosonde that also detects wind velocity by tracking the location of the radiosonde as it ascends. You may also see observations from radiosondes referred to as “RAOB” (Radiosonde Observation). ↩︎
The earliest readings dating to 1905! ↩︎
Whilst IAGOS humidity sensors are highly precise, there is some error in location and horizontal smoothing due to measurement lag. Some of this is due to a lag in the sensor itself (especially at low temperatures), meaning that the sensors can take 1–2 minutes (15–30 km at cruise speeds) to adjust to a sudden change in humidity. There's also a lag in the air passing through the aircraft systems and reaching the sensor. This requires a temperature correction since the process isn't isothermal. Finally, the aircraft is moving at ~900 km per hour (15 km per minute), and so these lags cause the sensor to effectively act as a low-pass filter, meaning it smooths out variations in humidity over some distance. If there's narrow plume of high humidity, the sensor may never register the peak humidity, with it being averaged out over areas of adjacent lower humidity. For more information, see P. Neis et al. (2015) Quality assessment of MOZAIC and IAGOS capacitive hygrometers: insights from airborne field studies.. ↩︎
Most humidity sensors work by measuring the number of water molecules in a given volume of air. At aircraft cruise altitudes, the pressure is very low, so there are a lot less molecules in a given volume of air. At these very low temperature, the maximum number of water molecules that can be in a given volume of air before they start condensing into liquid water is exceptionally small–this is called the saturation pressure of water. The low saturation pressures means we need very precise sensors to detect the number of water molecules in the air at cruise altitudes. Humidity sensors in many radiosonde are sufficiently precise, as are those present in IAGOS-albeit in both cases, the sensors require careful calibration and correction for known biases. Whilst WVSS-II is sufficiently precise to measure humidity accurately at low altitudes (warmer, higher pressure), it struggles at cruise altitudes. ↩︎
Geostationary cameras have better pixel resolution in the visible spectrum (~0.5km), but these spectral bands are less useful for contrail detection. ↩︎
Recent work has allowed some estimation of the altitude of contrails directly from satellite images. This has been achieved by training a machine learning algorithm on images of contrails found from GOES-16 ABI infrared imagery whose heights have been determined with satellite-based LiDAR (Cloud–Aerosol Lidar with Orthogonal Polarization (CALIOP) data). The quoted error (RMSE) is 570 m, which is approximately 2 flight levels. For more information see:
- V.R. Meijer et al. (2024) Contrail altitude estimation using GOES-16 ABI data and deep learning. Atmospheric Measurement Techniques, Volume 17(20)
For further reading on the limitations of geostationary satellites, see some recent works:
- O.G.A. Driver et al. (2025) Factors limiting contrail detection in satellite imagery. Atmospheric Measurement Techniques, Volume 18(5)
- A. Sarna et al. (2025) Benchmarking and improving algorithms for attributing satellite-observed contrails to flights Atmospheric Measurement Techniques, Volume 18(14)
For those that are interested, the contrail was recorded at 56° 6' 41.66" N x 26° 21' 17.86" W at 36,000 feet, on VS137 at 18:47 UTC on 20th September 2025. ↩︎
This is actually the very first shot that we have of contrail formation from an aircraft tail camera. Whilst there are lots of publicly available videos of passengers recording the tail-cam footage from the aircraft in-flight entertainment systems on YouTube, they are either all during take-off and landing, or don't show any contrails. We've had one or two more submitted to us by the public, and so far, all on Airbus A350s. If you're flying on a widebody aircraft (twin aisle), take a look at the in-flight entertainment system and see if you can find a view of the back of the engines. If you can manage to take a picture or video of it recording a contrail, we'd love to hear from you! ↩︎
A. Sondabend-W et al. (2026) Observing long-lived longwave contrail forcing. Atmospheric Measurement Techniques, Volume 19(5) ↩︎
Reanalysis products are irreplaceable inputs for contrail evolution models. These models need a complete picture of temperature, pressure, humidity and wind speed-not just at the initial formation site and time-but throughout the life of the contrail in all of the area that it grows and falls into. No observations give us this: for instance, humidity measurements give us humidity along a single line through space (a profile) at one particular time. ↩︎
For those interested in how we determined the precision and coverage of different techniques:
- Coverage was here defined as the fraction of the volume of cruise altitudes (FL270 to FL440) over the entire global surface area that were covered by an observation
- For IAGOS and GRAUN, 2024 datasets were used to determine coverage, by counting the number of 0.25° x 0.25° x 1 hour grid cells that contained measurements.
- Precision for GRUAN and IAGOS are based off the quoted uncertainty of humidity measurements in these products
- MADIS radiosondes and IGRA radiosondes were scaled off the GRAUN results, based on sampling of daily relative launch frequency (3x for MADIS, 10x for IGRA, only including RS41/92 measurement)
- MADIS WVSS-II was scaled off IAGOS, based on information that there are around 140 WVSS-II reporting aircraft vs. 10 IAGOS aircraft. Precision is based on approximate humidity accuracy.
- Geostationary satellites between GOES, MTG and Himawari cover around 95% of all traffic. Precision of Linear Contrail Detection (67%) was based on testing of geostationary satellite LCD algorithms against synthetic data presented in Sarna et al. (2025)
- GMN ground camera coverage is based on estimates by the GMN team, based on the current coverage. Precision (for non-persistent detection) is also based on unpublished comparison work to IAGOS and other observations by the GMN team.
- Tail camera coverage is estimated based on an assumption of 600 A350s in the current global fleet, and an assumption that cameras do not work 50% of the time (at night-time). It is then scaled off IAGOS figures.
A trifle is a British layered dessert traditionally comprising a thin layer of sponge cake soaked in sherry, a layer of jelly and fruits, custard, and whipped cream in ascending order. Gemini's attempt at drawing a traditional British Trifle:
 ↩︎ ↩︎
↩︎ ↩︎