
Introducing the Contrails.org Impact Explorer
This post describes our new interactive tool for quantifying and visualizing the climate impact of contrails.

"Without data, you're just another person with an opinion." — W. Edwards Deming
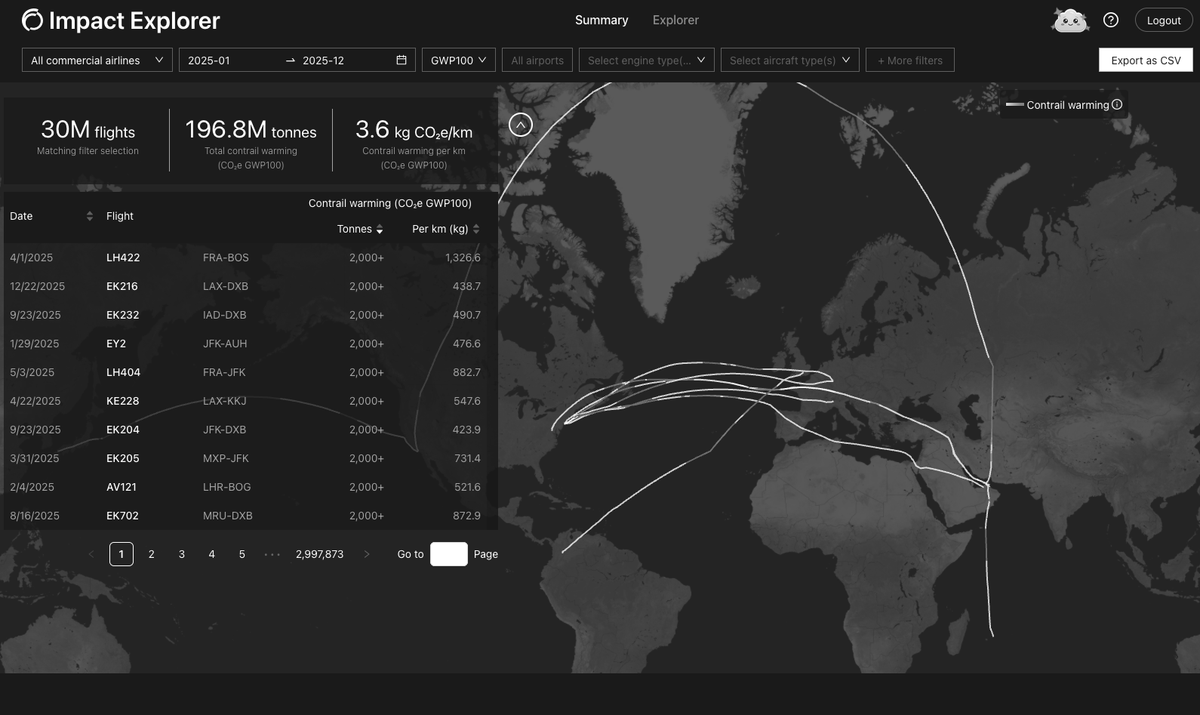
We're excited to announce the Contrails.org Impact Explorer (explore.contrails.org), a new interactive tool for quantifying and visualizing the climate impact from contrails on historical flights.
Contrails are modeled on global ADS-B flight paths using CoCiP and ERA5 meteorology.[1] The result is a per-flight estimate of contrail climate effects at global scale back to 2019–where contrails form, how long they persist, and their expected climate warming effect.[2]
Beyond modeling the contrail impact of every flight, the Explorer lets users investigate each flight further, including the fraction of flight distance where contrails were detected by satellites[3] and the ability to simulate basic contrail avoidance along the trajectory.
Why a new tool? Why now?
Back in 2021, we built the Contrails Map as an educational tool to build intuition and awareness around contrail-climate impacts. The map proved to be highly effective at communicating the breadth and dynamics of the problem.
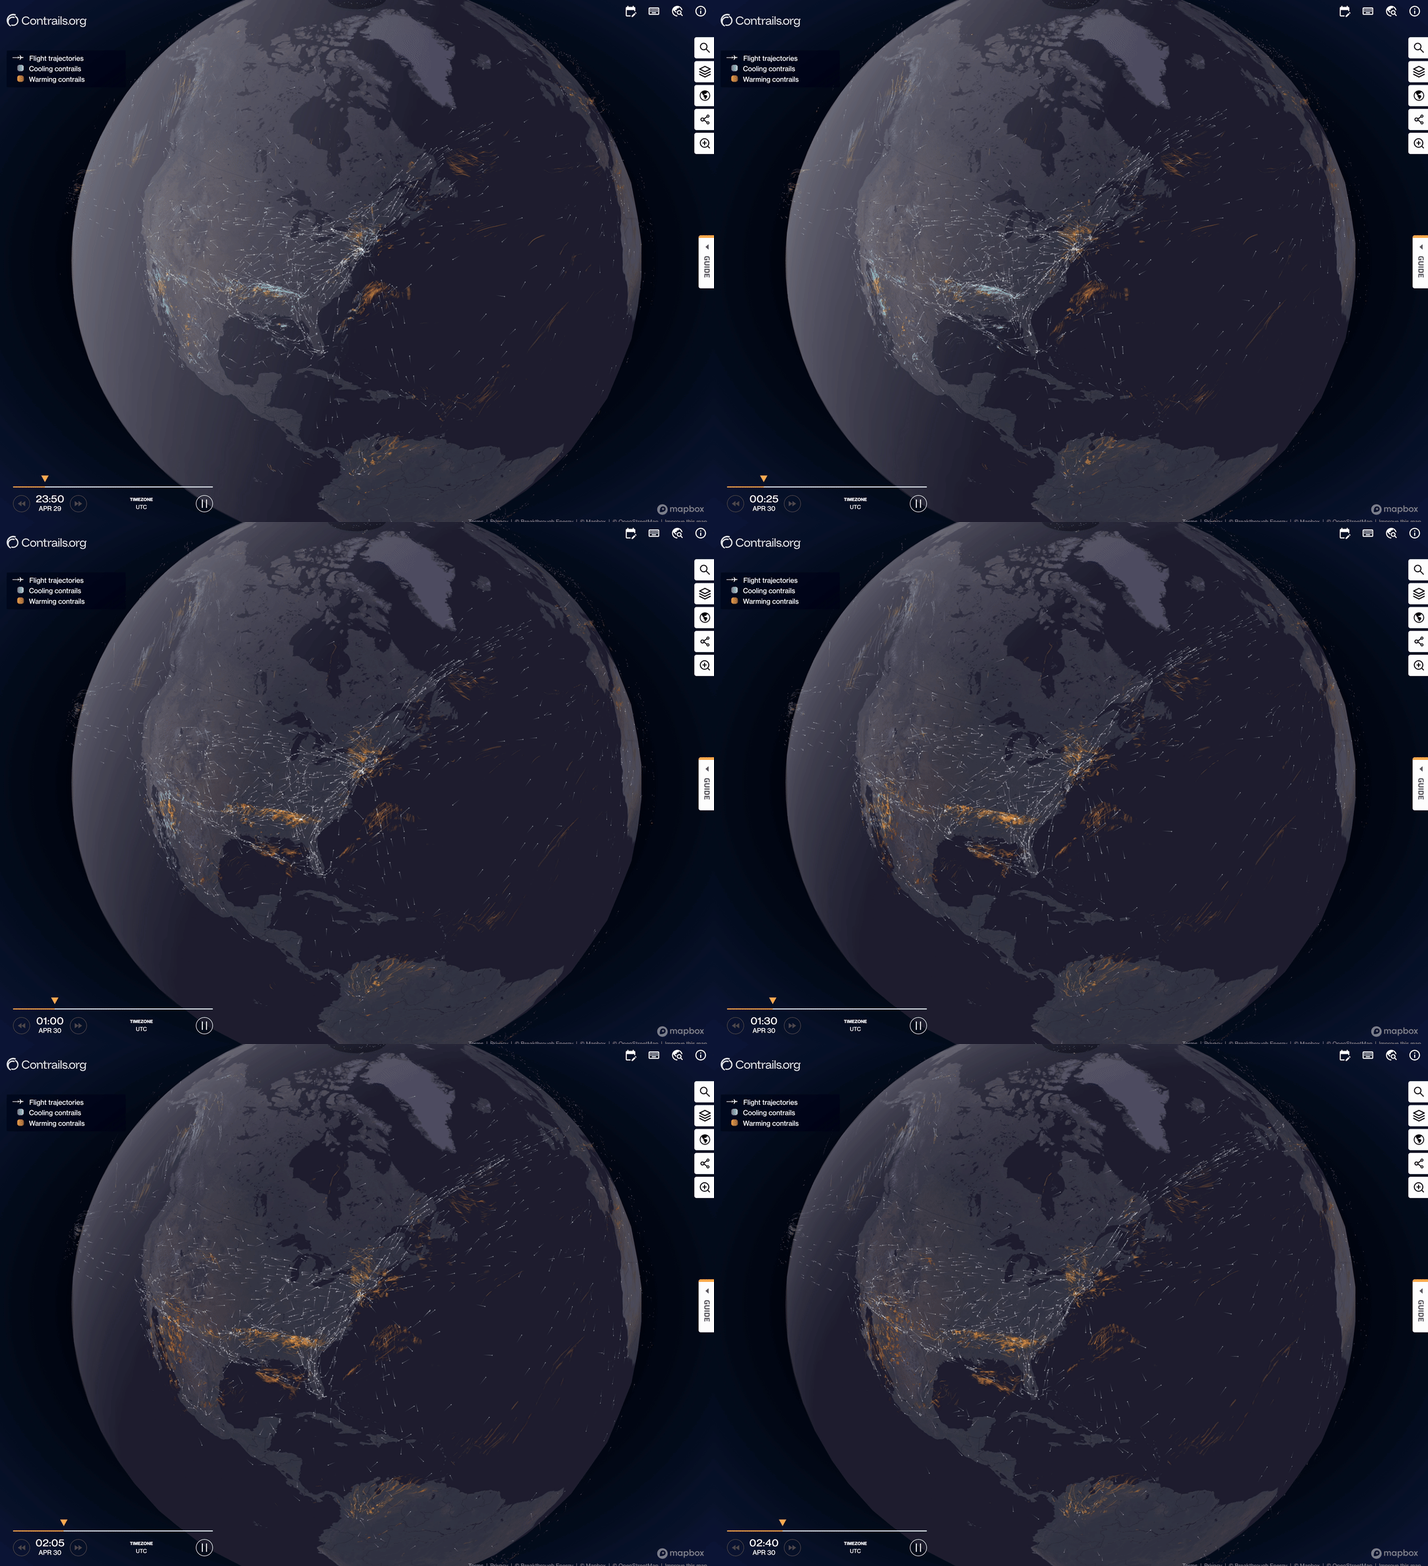
The Contrails Map visualizes contrail effects from global aviation.
The map evolved over time to include new capabilities like satellite image overlays, ground camera images, and search capabilities. But it was never intended to serve as a data platform for quantifying impacts on a granular scale.
In parallel, we started working with Roger Teoh and Imperial College in 2022 to develop a high-fidelity global aviation emissions inventory based on ADS-B (GAIA) covering 2019–2021 (Teoh et al. 2024a). We used this inventory to build a bottom-up estimate of global contrail effects covering these same years (Teoh et al. 2024b).
Through this work, we made many improvements to flight processing and contrail modeling, those improvements finding their way back into our open-source python library (pycontrails) that now supports many researchers worldwide.
While the map provided a valuable visualization and the GAIA publications a rigorous snapshot of historical as-flown impact, we had many requests for an ongoing accessible and defensible dataset representing the best-available estimates of per-flight contrail impacts.
Thus, the Impact Explorer.
Where does the data come from?
The data for the Impact Explorer is generated by running the Contrail Cirrus Prediction (CoCiP) model on commercial flight paths. We use the European Center for Medium Range Weather Forecasting (ECMWF) ERA5 reanalysis data as input meteorology. For aircraft performance and emissions modeling, we use either the Poll-Schumann (PSFlight) or Base of Aircraft Data (BADA) model with aircraft body type as reported via ADS-B and engine type as reported in a privately maintained lookup of commercial aviation fleet composition.
Some flights are excluded from the Impact Explorer inventory, mostly because we are missing input data. This includes (but isn't limited to) poor ADS-B telemetry data, missing aircraft composition (engine information), or missing aircraft performance information.
We released the source code and technical documentation for the flight processing pipeline on github. For those requiring full defensibility, we'll be sharing an audit bundle with end-to-end provenance documentation supporting transparency and reproducibility.
Current features
The Impact Explorer has two main views: The Summary page and the Explorer page.
Summary Page
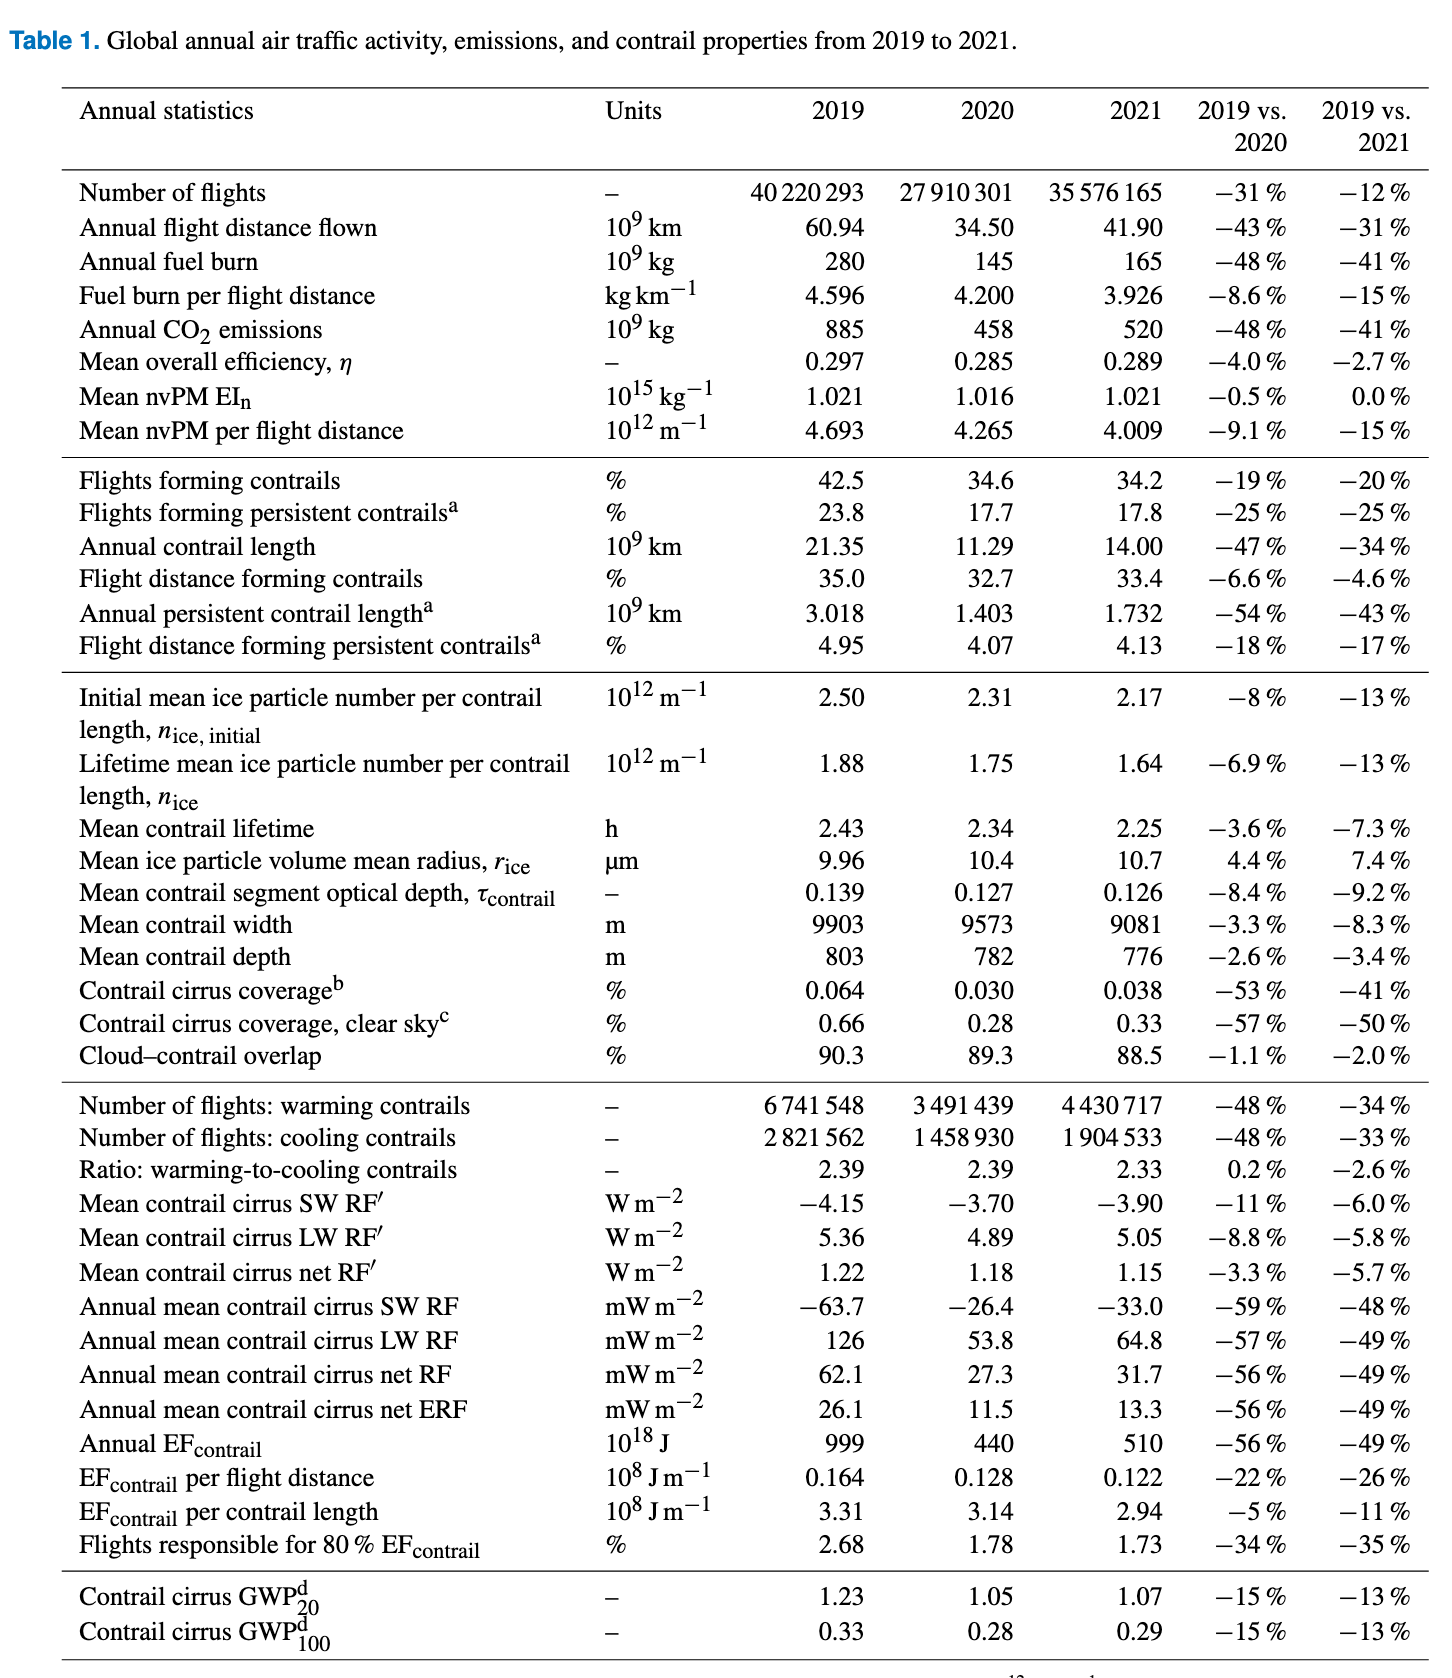
The Summary page provides roll-up statistics and general information on the contrail impact of the selected flights over the time period chosen in the toolbar. These figures are similar to the numbers shown in Table 1 in Teoh et al. 2024,[4] but specific to the filters chosen in the toolbar.
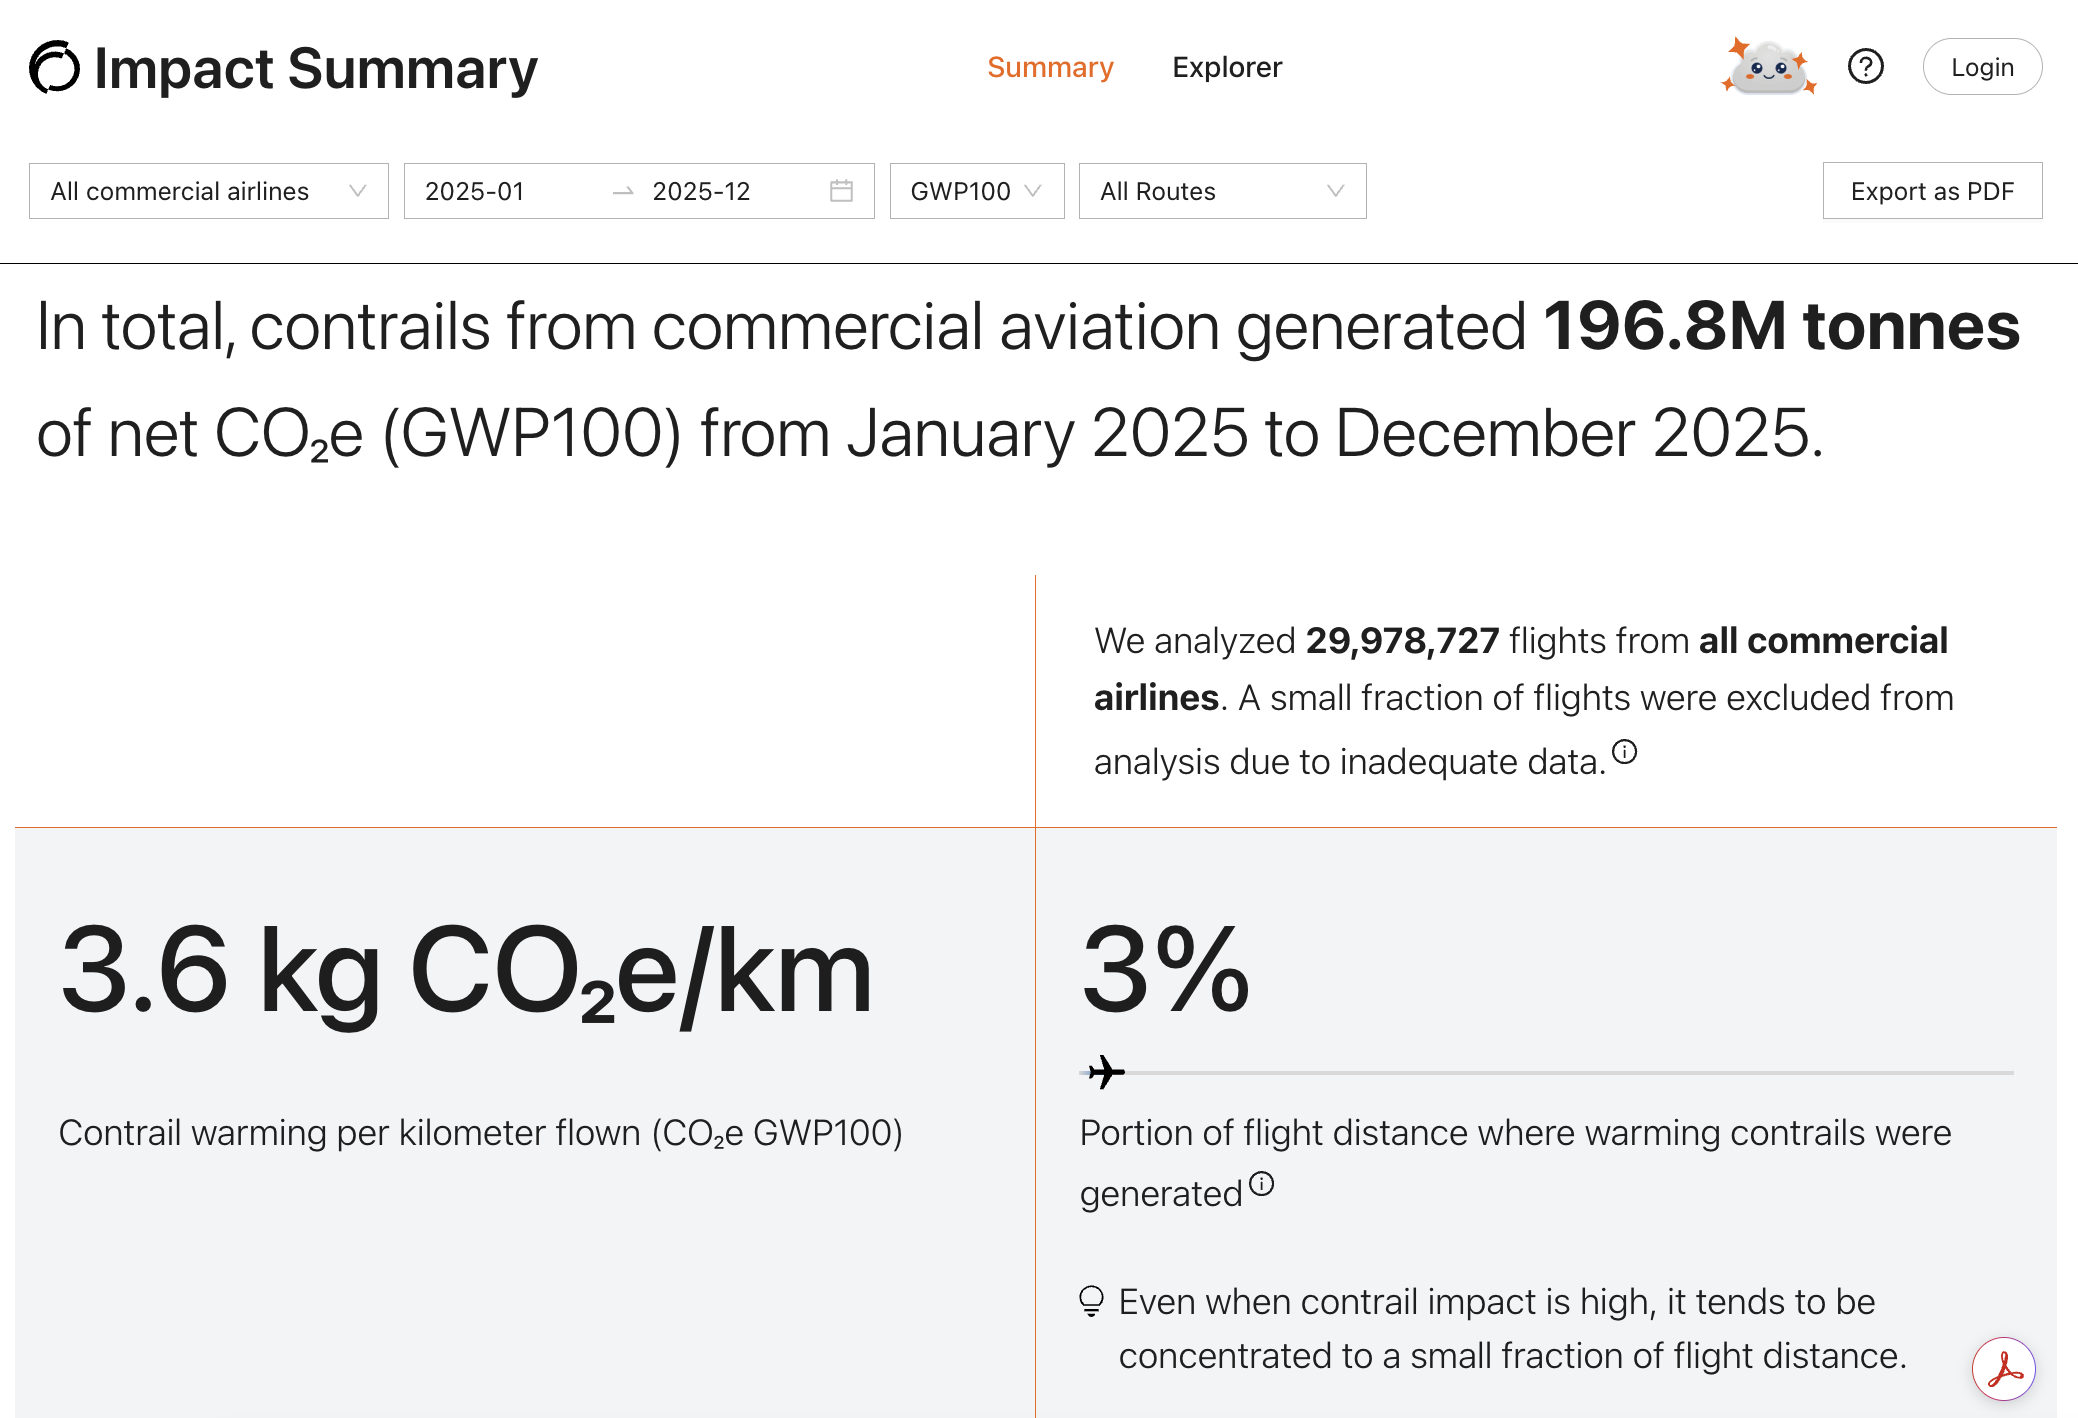
Screenshot of a the Summary Page
Airline representatives can request a token and login, allowing them to select just the flights from their airline in the filter toolbar. If you are an airline representative, request a login token at api@contrails.org.
Explorer Page
The Explorer page lets users filter and paginate through specific flights. A user may, for example, look at flights during a specific time window, originating from certain airports and sort the list of flight by the magnitude of contrail impact.
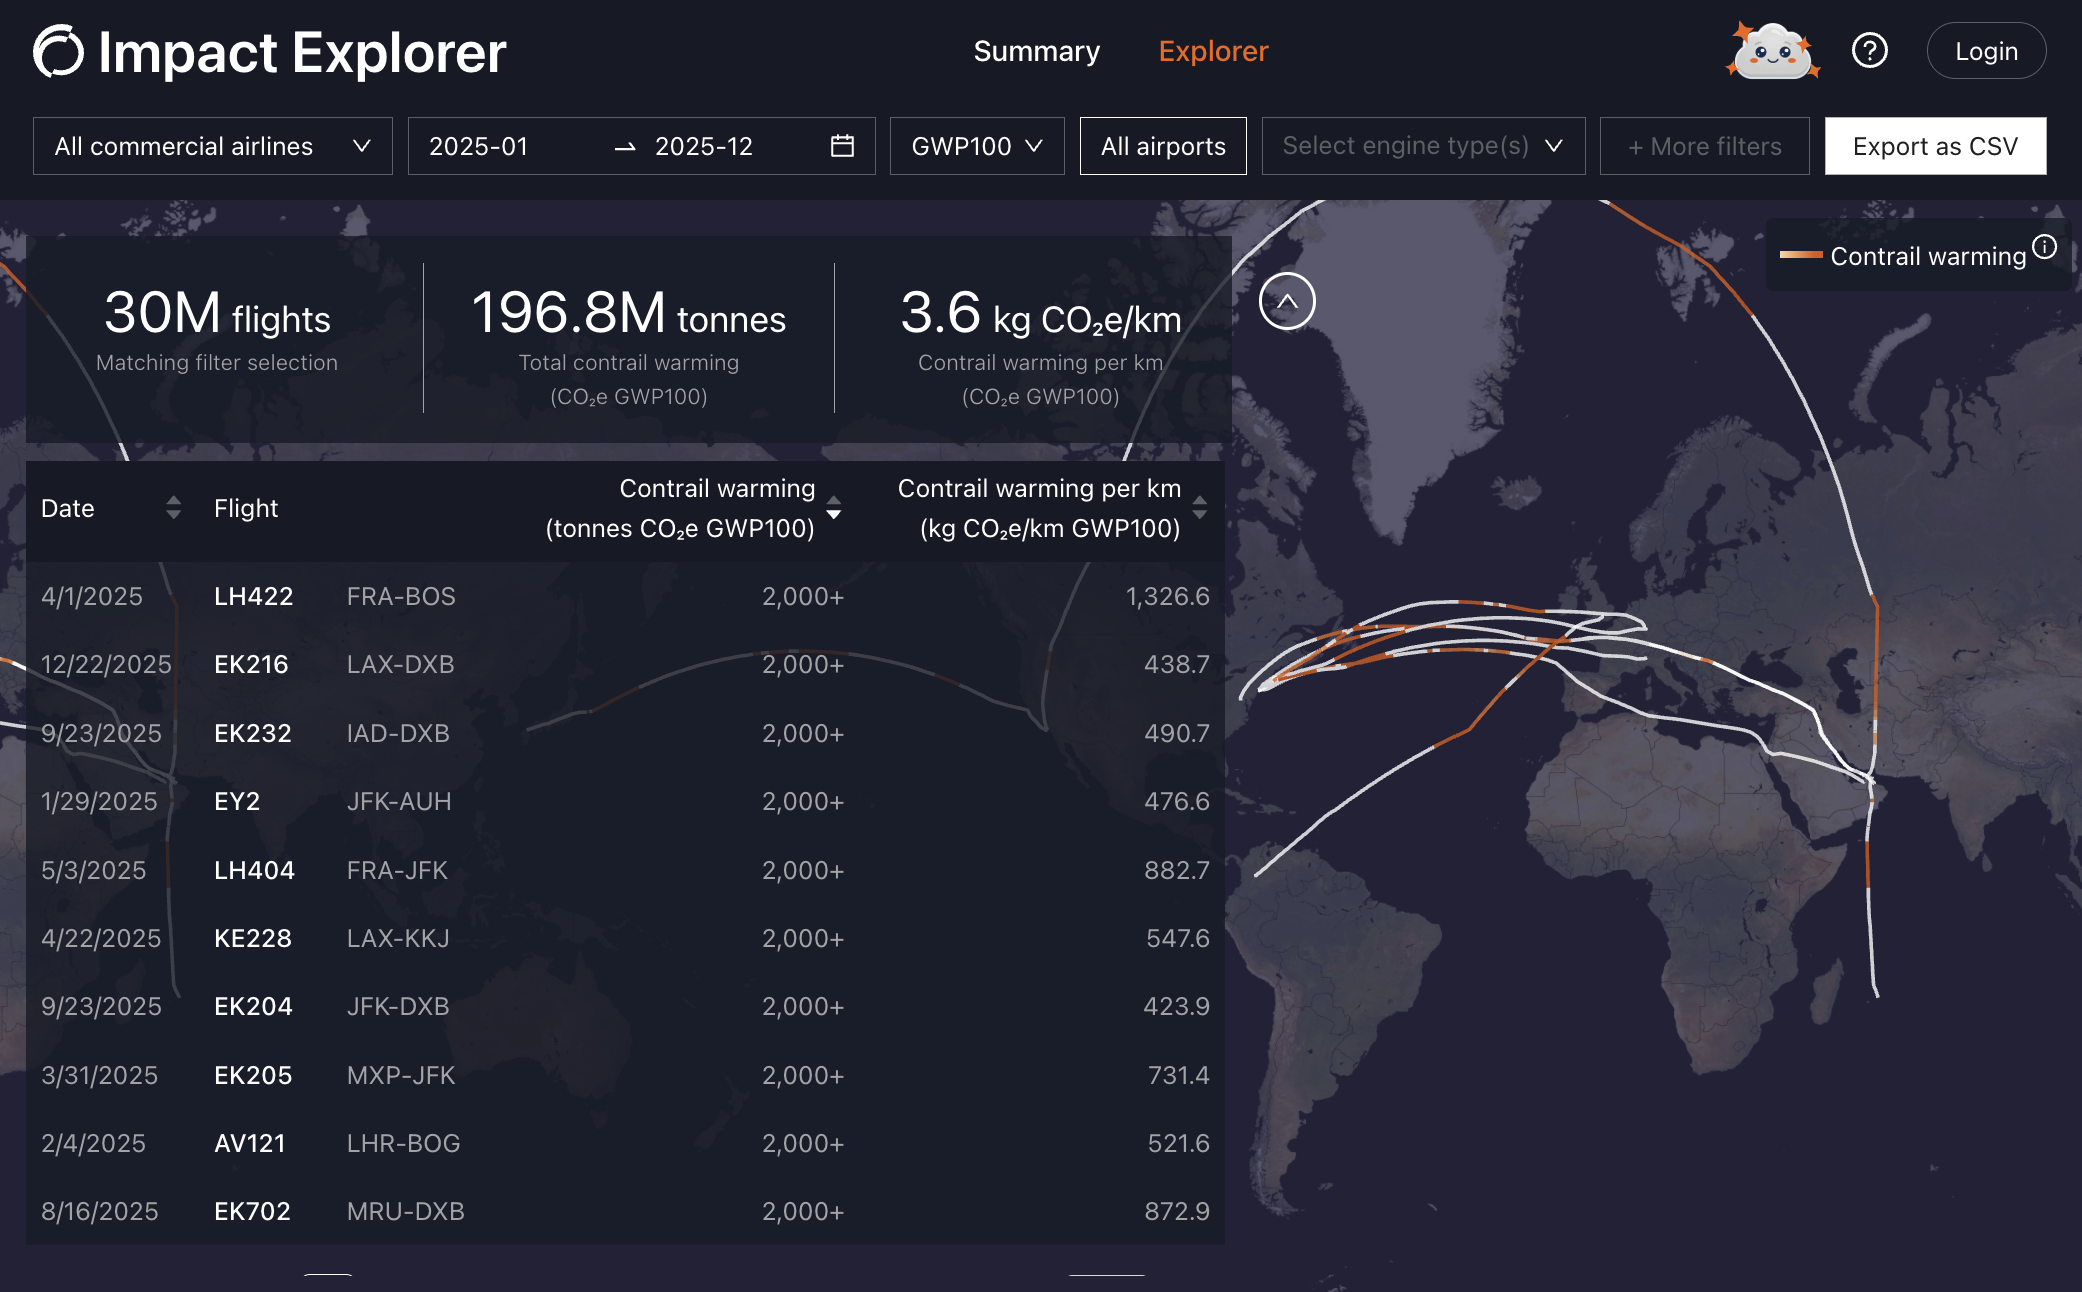
Screenshot of the Explorer page
Any user can request a token and login to export the data behind these flights. If you interested in exporting data, request a login token at api@contrails.org.
Clicking on a certain flight will open that flight's specific details. A plot shows the flight's vertical (altitude) profile along the flight path, as well as the areas of the atmosphere where contrails were predicted to have formed. Most flights are flown along a path that is cost optimal, flying at altitudes, speeds and along a path that minimizes the cost of fuel, time, and airspace.
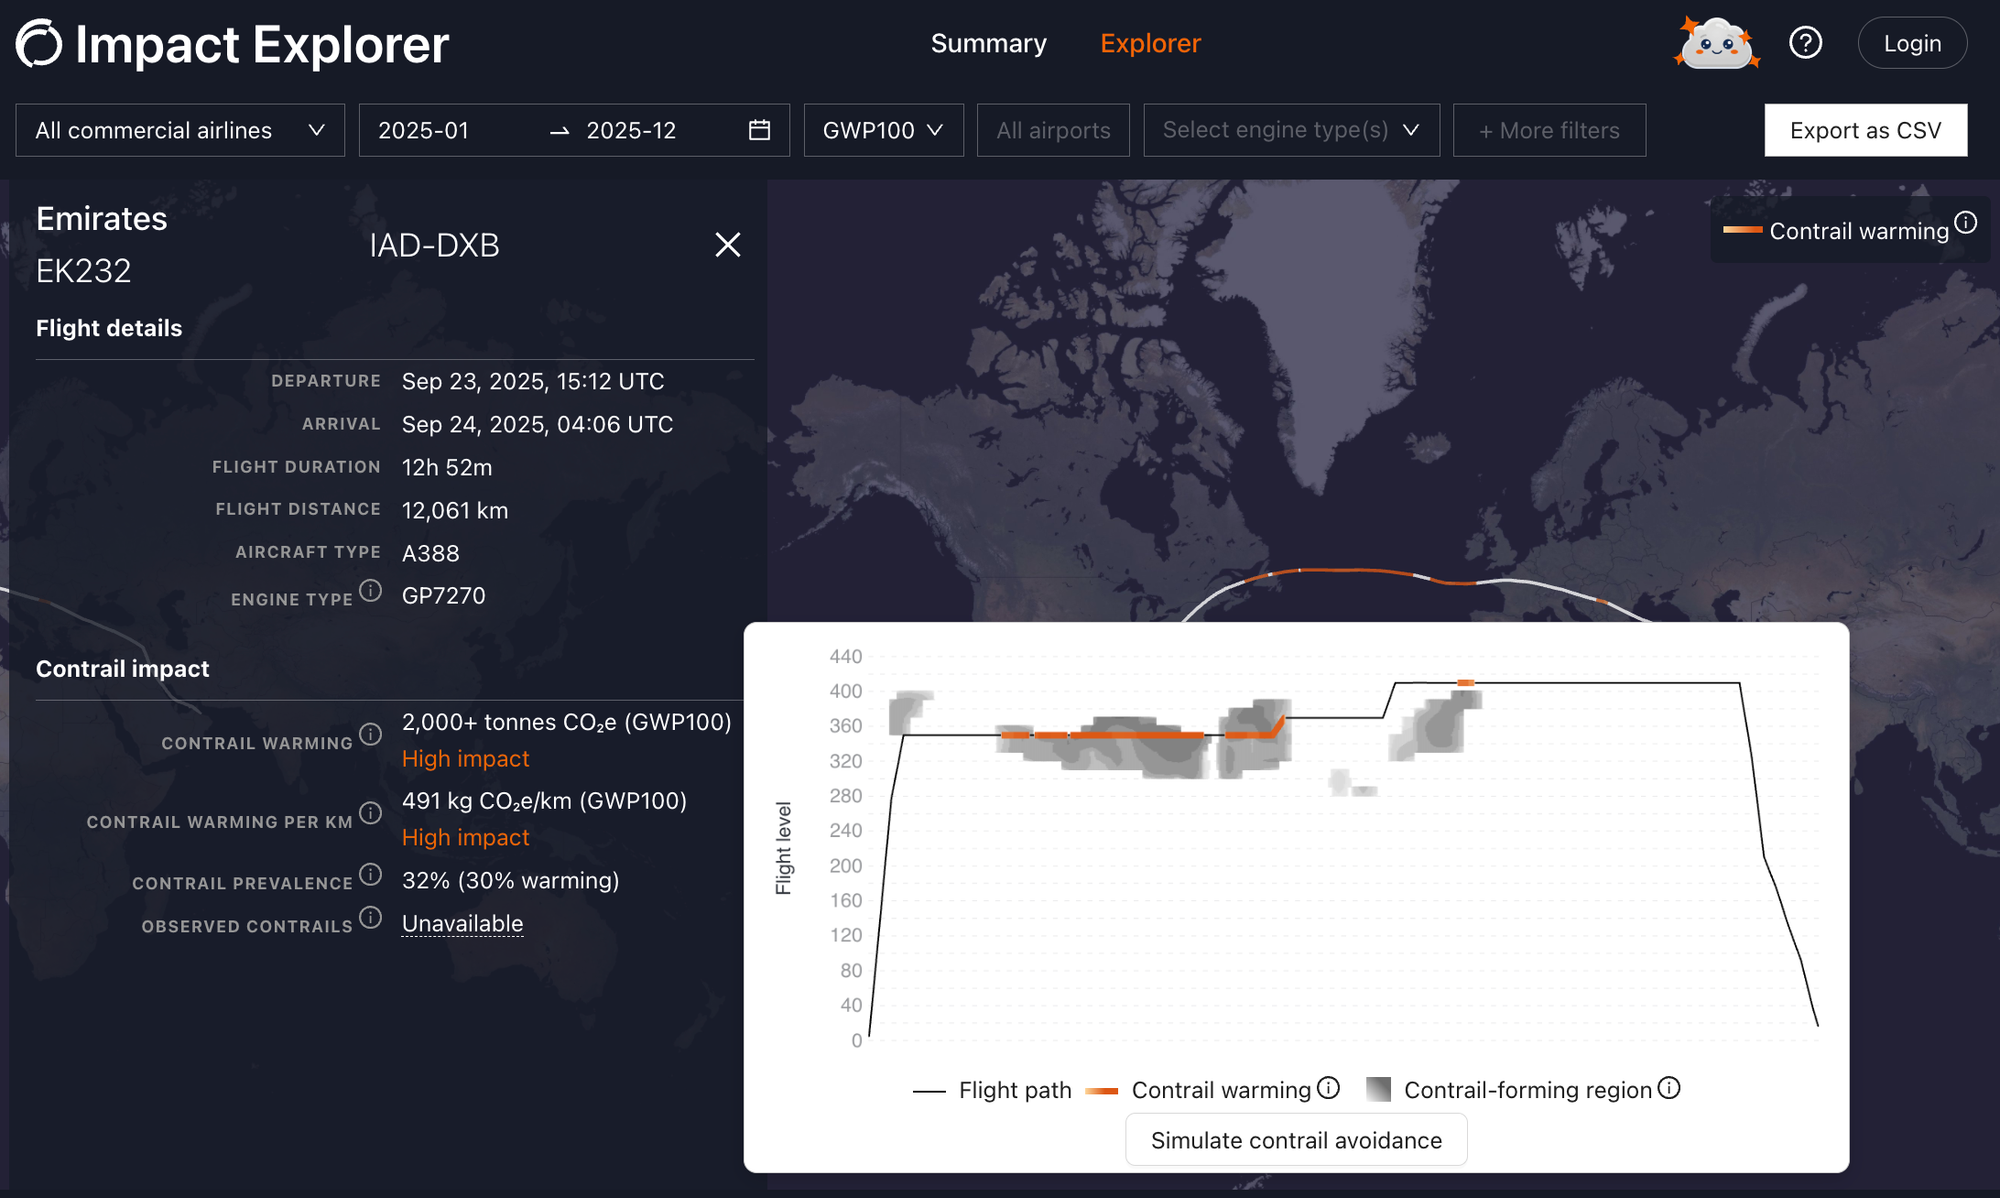
The details pane shows Observed Contrails for the flight, which is the portion of flight distance where contrails were observed via satellite imagery. This data is linked in from Google's ContrailWatch database of contrail detections from geostationary satellites. These observations are used to enhance and evaluate the models that predict contrails, and efforts are underway to improve observation techniques and coverage.[5]
Coming Soon
In the flight view, you can select Simulate contrail avoidance and the tool will trace a hypothetical alternative contrail avoidance route. We estimate the additional fuel burn, changing the altitude at certain points of the flight to avoid contrail formation. For now, this alternative route is for illustrative purposes and likely doesn't represent the most feasible alternative.
In the future, however, we hope to simulate feasible alternative routes for all these flights, incorporating practical operational and cost constraints (stay tuned!). Once we can simulate contrail avoidance routes with higher fidelity on a per-flight basis, stakeholders may use the Impact Explorer tool to probe bottom-up costing estimates for avoidance (e.g. "if Acme Airlines had avoided just these flights, what would have been the approximate fuel cost and at what contrail impact savings?").
Get involved
We're excited to share this new tool, and we'll be continuing to improve it throughout the year. Reach out to info@contrails.org if you'd like to learn more and sign up for the Notebook to receive notifications of future Contrails.org blog posts.
Some flight planning software systems have contrail forecast and avoidance capabilities,[6] and airlines are testing them out in practice.[7] New airlines should get involved by asking their flight planning software providers for this capability.
Acknowledgements
The Contrails.org Impact Explorer was made possible through the support of a Google.org Fellowship, in which a team from Google joined Contrails.org on a full-time, pro bono basis for 6 months. Read the full press release here.
Footnotes
ADS-B flight paths are processed through aircraft performance and emissions models to initialize CoCiP. See where the data comes from for more details. ↩︎
The Explorer currently has data back to 2024, but will eventually have data back to 2019. New data will get added quarterly. ↩︎
Google's ContrailWatch dataset provides contrail detections from geostationary satellites attributed to individual flights. ↩︎
Table 1 from Teoh et al. 2024
 ↩︎
↩︎See our previous post on Observing Contrails for more background, and look out for our new framework on model evaluation (ContrailBench), coming soon! ↩︎
See the previous study from Flightkeys in 2024 (Martín-Frías et al. 2024). ↩︎
See the recent pre-print on an American Airlines trial in 2025 (Sankar et al. 2026). ↩︎