The Cost of Contrail Management
This post presents an order-of-magnitude estimate for the long-term cost-benefit of navigational contrail avoidance. At the end, we've built an interactive tool to explore the sensitivity of abatement cost to assumptions.

We hear different figures for the cost of contrail management, e.g., $5/flight, $1/tonne CO2eq, €2/ticket, but where do these numbers come from? This post presents an order-of-magnitude estimate for the long-term cost and benefit of navigational avoidance, with an interactive tool at the end for exploring how abatement costs change under your own assumptions.
In our first notebook post, we noted that contrails are responsible for 1–2% of all human-caused warming. Crucially, we also noted the cost of avoiding contrails should be very low–between $1 and $10 per tonne CO2 equivalent (CO2eq) warming avoided.
That is 10 to 100 times less expensive than Sustainable Aviation Fuels (SAF) or other carbon dioxide removal (CDR) strategies.[1]
If you're aware of contrail impacts on the climate, this isn't news to you. The low abatement cost makes contrail avoidance one of the most attractive climate solutions available. Even in the most pessimistic scenarios, it promises to be one of the lowest cost methods to reduce climate warming.
In this post, we want to explain how we estimate contrail avoidance costs at scale, and give you an interactive tool that lets you explore how costs could vary under different scenarios.
Skip right to the dashboard if you learn better by tweaking the dials.
The Cost of Contrail Management
Aircraft can often avoid making persistent warming contrails by flying above, below, or occasionally around certain ice-supersaturated regions of the atmosphere. This approach is known as navigational contrail avoidance (see our previous post on Contrail Regions).
To make this work at scale, flight planners, pilots, and air traffic managers need the capability and confidence to reroute effectively. While some reroutes come at no added cost, many require flying slightly off the fuel- or cost-optimal path.
This analysis lays out an "order-of-magnitude" estimate for the long-term cost of navigational avoidance. The tool at the end lets us explore the sensitivity of that cost to assumptions. We make these estimates to the best of our knowledge today to inform how contrail avoidance compares with other climate opportunities.
Our central estimate is that aviation can avoid harmful contrails for ~$1.75 per tonne CO2eq.[2] Within reasonable uncertainty bounds, the cost could be as low as $0.50 per tonne CO2eq, or as high as $14 per tonne CO2eq. Even at the high end, this cost remains a fraction of most other climate solutions.
Our cost analysis has four components (in decreasing order of significance):
- Additional fuel burn for contrail avoidance (Fuel)
- Forecast and measurement infrastructure (Infrastructure)
- R&D investment (R&D)
- Human Capital (Workforce)
Additional Fuel Burn
Navigational contrail avoidance will often involve flying off the fuel-optimal flight routing. In practice this means that contrail maneuvers will introduce a small additional fuel cost to the operator. Aircraft often fly off the fuel-optimal routing (e.g., for turbulence, airspace closures, delays), but in general airlines are trying to minimize their fuel burn (and cost) when routing flights.[3]
We estimate the added fuel for contrail avoidance at scale will be between 0.1%—0.5% current fleet-wide fuel consumption. Assuming 0.3% added fuel, contrail avoidance represents an annual cost to operators of $732M per year ($19 per flight) at today's fuel prices and traffic levels. This sounds massive, but airlines spend around $900B a year, so this is less than 0.1% of expenses.[4] The added fuel burn alone represents 93% ($1.63 per tonne CO2eq) of the abatement cost in our central estimate.
Some potential rerouting costs don't scale cleanly with fuel burn, like overflight charges (when deviating horizontally) and engine maintenance. Our large-scale simulations (described below) show these costs on average scale loosely with traffic volume and therefore fuel burn. We account for these costs by adding an extra rerouting factor on top of the additional fuel cost. For the central estimate we use a factor of 1.15, effectively increasing the additional fuel costs by 15%. This is an imperfect method–we'll improve with more simulations and real world data.
The additional fuel and routing cost is by far the largest cost of contrail management. Fortunately, it's also the most controllable. We can set hard limits on how much fuel we are willing to spend and how we deviate, increasing our tolerance as we gain confidence in the efficacy of interventions.
Read more details on Additional Fuel Burn
We base our estimates for the additional fuel burn on flight simulations in commercial flight planning systems, with backup from a few early live trials.
Flight Planning Simulations
In 2023, we simulated ~85,000 American Airline (AA) flight plans in the Flightkeys commercial flight planning system (Martín Frías et al. 2024). The trajectory optimizer could achieve 73% reduction in total contrail warming for +0.11% fuel increase across all flights.[5] The added fuel on individual flights was often higher (~1–3%), but only a minority of flights (~5%) require diversion.
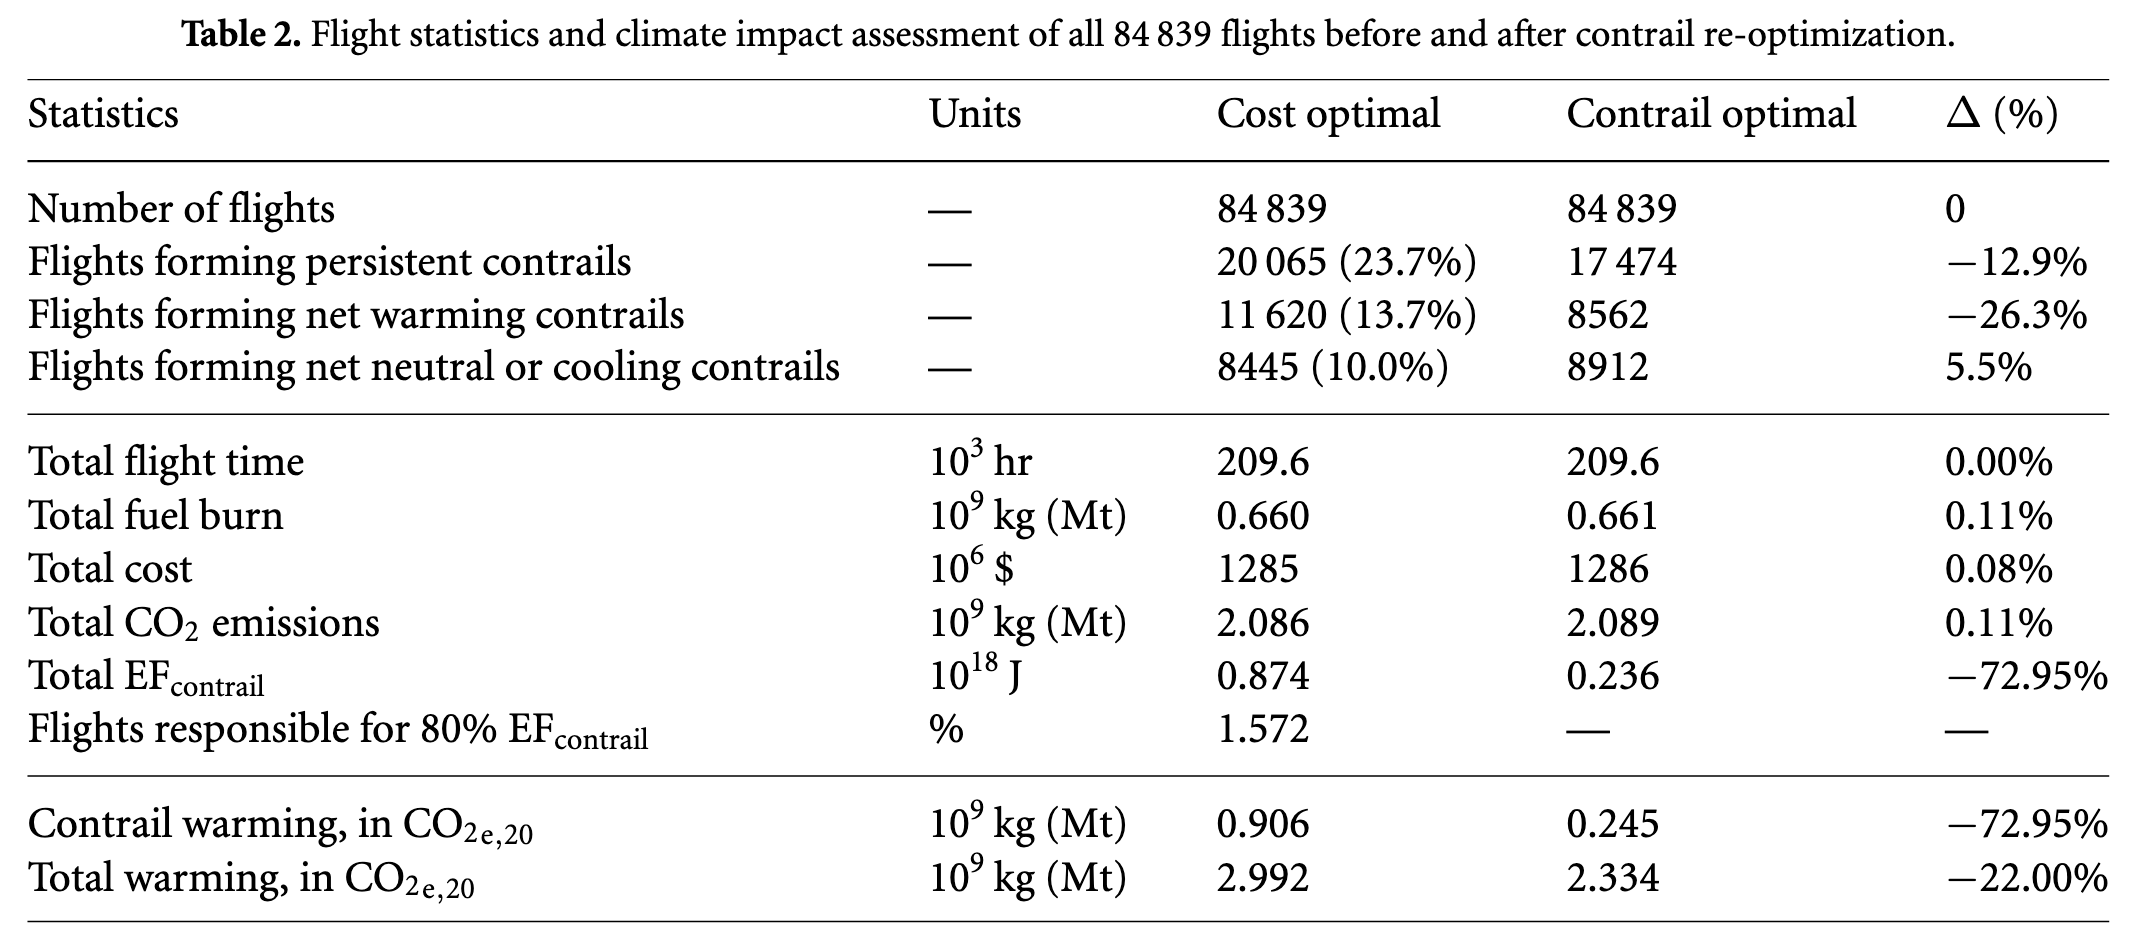
In this study, we found the additional fuel made up 85% of the total avoidance cost.[6] This is our only datapoint for the rerouting factor that we are assuming (on average) will scale with air traffic (and therefore fuel burn). We assume an additional ~15% of the added fuel cost to account for other non-fuel rerouting costs.
Flight Trials
Some trials have quantified the additional fuel burn in practice. In a study with Google and American Airlines, we tactically deviated flights by delaying the plane's climb after takeoff or descending early before landing to avoid flying through contrail forming regions (Sonabend et al. 2024).
We did not expressly limit (or optimize) additional fuel burn on avoidance flights—executing avoidance maneuvers at the pilot's discretion. We observed a 54% reduction in contrail length for an average 2% additional fuel burn on flights that performed avoidance. If we assume only ~5% of flights need intervention, then (naively) scaling up 2% additional fuel x 5% of flights = 0.1% added fuel across all flights.
Additional Fuel Burn Estimates
No trial or simulation has managed to fully simulate the impact of navigational contrail avoidance at scale, i.e., an airspace level. There will likely be additional fuel burn for accommodating increased traffic outside contrail regions or carrying additional fuel for avoidance maneuvers later in flight.
In the long term, added fuel needs to be considered in the context of mitigation efficacy—chasing higher efficacy will generally lead to higher fuel burn. We can limit the additional fuel on individual flights to minimize adverse impacts. This is entirely controllable in the eventual system design.
For this model, we assume an added fuel burn of +0.3% (Optimistic 0.1%, Pessimistic 0.5%) across all flights. We increase the additional fuel cost a rerouting factor of 1.15 (Optimistic 1.10, Pessimistic 1.20).
Aviation Fuel Consumption
According to 2025 IATA Industry Statistics, jet fuel cost the global airline industry between $190 and $280 billion annually in recent (non-COVID) years. Taking annual, global averages, fossil Jet-A cost operators between $2.05 per U.S. gallon (2025 expected) and $2.67/gal (2023) over the past three years.[7]
Using the same IATA data, the aviation industry (in 2025) is expected to carry 1.19 trillion Revenue-Tonne-km (RTK) on around 38.3M flights. Revenue-Tonne-km (RTK) is a metric the industry uses to measure the total work aviation does, combining cargo and passengers (often on the same plane).[8] It adds up how much cargo and passengers (~100 kg each, including bags) are actually carried, multiplied by how far each are carried, each year. The expected figure for 2025 is around 5.3% higher than in 2024, and 9.1% higher than the pre-COVID peak of 2019. RTK is expected to grow at around 3-4% annually between now and 2050, meaning flight volume and RTK are expected to more than double–perhaps nearly triple–by 2050.
Fuel consumption per RTK has steadily fallen over time through more efficient aircraft and better operational efficiency. The 2025 global annual efficiency (0.087 gal/RTK) is expected to slightly improve on the pre-COVID best (2019, 0.088 gal/RTK).[9] This efficiency will likely continue to improve by 1-1.5% per year. This means fuel efficiency in 2050 might be around 25% better: 0.060 - 0.068 gal/RTK.[10]
We set the price of fossil Jet-A to the expected 2025 price of $2.05 per US gallon (Optimistic $2.00/gal, Pessimistic $2.80/gal).[11] We set the fuel efficiency to 0.087 gal/RTK and the total annual Revenue-Tonne-km carried by aviation to 1.19T RTK (reflecting 2025 expectations).
We calculate the total annual fuel cost:
Estimated Cost of Additional Fuel Burn
With the assumptions above, our estimate of additional fuel costs and associated rerouting costs for global contrail avoidance is $732M per year (Optimistic $228M per year, Pessimistic $1,739M per year). It's important to note that the additional fuel cost would be higher if SAF is used (SAF is much more expensive than Jet-A today).
Forecast and Measurement Infrastructure
Some amount of new infrastructure will be required to enable effective contrail avoidance at scale. The infrastructure can be split into two categories:
- Forecast and planning infrastructure to inform contrail aware flight operations
- Measurement and observation infrastructure to monitor contrail effects
Both will require up-front investment to develop, but we'll consider this part of the R&D Investment.
Forecast and planning infrastructure are unlikely to require significant recurring cost after development. It's not yet clear what level of measurement and observation infrastructure will be necessary to support avoidance at scale–its possible the data we have today is close to sufficient. This is an important outcome of R&D over the next years.
Our fairly qualitative take (as of today) is that we'll need some amount of new data (more humidity sensing in the atmosphere, and likely a bit more imagery), but it's impractical (and likely infeasible) to build a comprehensive contrail measurement and observing system.
We estimate we need to spend around $20M each year on the infrastructure required to forecast, monitor, and measure contrails. This will be dominated by the cost of measurement and observation infrastructure to improve forecasts and increase confidence in real-world impacts.
Read more details on Forecast and Measurement Infrastructure costs
Contrail forecasts run on (or within) pre-existing meteorology products, and require marginal annual compute costs (<< $1M/year). Flight planning and air traffic service providers may charge fees for contrail avoidance features, but unless contrail management becomes a profit (or cost) center for airlines, the features are unlikely to demand a premium.
Measurement and observation infrastructure may require long-term investment, but defining the scope of necessary infrastructure is an active area of R&D. It's possible that current geostationary satellites (NOAA's GOES over North and South America, EU's Meteosat over Europe-Africa, and Japan's Himawari over Asia-Pacific) are sufficient. If that's true, the annual cost of running algorithms and serving data to relevant parties is trivial.
But effective mitigation may require new infrastructure to increase confidence in interventions. Potential infrastructure falls into three subcategories:
- On-aircraft humidity sensors: 10 commercial aircraft (globally) host calibrated water vapor sensors that can detect contrail regions with sufficient accuracy (IAGOS). Another 140 are fitted with water vapor sensors that report humidity to weather services but are inaccurate at contrail conditions (AMDAR). These measurements improve the weather forecasts through data assimilation and help inform contrail formation models. IATA estimates it will cost about $20M up front + $12M / year to deploy new sensors on 1,000 aircraft.[12] This is probably a bit high, but it's also impractical (and unnecessary) to outfit the global fleet (~27,000 jet aircraft) with humidity sensors. We believe we'll need modest expansion of humidity sensing to at least improve upper atmospheric weather forecasting.
- Low-Earth Orbit (LEO) satellite constellations: LEO satellites have much higher resolution than geostationary satellites, but low revisit (i.e., images of the same spot over time). They also don't generally image in the thermal bands we need for 24-hour contrail detection (mid to long-wave infrared). There are constellations in development better suited for contrail monitoring (e.g., FireSAT), or we could consider creating a dedicated network of LEO satellites for contrail monitoring. While many governments (and NGOs) share satellite data freely, commercial data can cost up to $1M / year. Building a fit-for-purpose LEO constellation would cost ~$500M with an average useful life of ~5 years. We don't expect to need a dedicated contrail constellation, but we do expect to utilize more LEO imagery from new and existing constellations in the future.
- Ground-based camera networks: Ground-based cameras looking at the sky can detect contrail formation in a similar manner to satellites. The Global Meteor Network has repurposed their broad network of sky-facing cameras for contrail detection (~$100/camera). Other high-fidelity all-sky imagers (e.g., Reuniwatt and Miratlas) support research studies across the EU ($10k-$100k / camera). If we want to build a dedicated ground camera network, it would require about 50,000 cameras to cover global landmass.[13] If we want to expand across oceans, we could consider shipping platforms or weather buoys...but this starts to become harder to rationalize.
If we assume a modest level of new monitoring infrastructure, we estimate annualized costs as $20M per year (Optimistic $10M per year, Pessimistic $200M per year). In all cases, the annualized costs of this infrastructure are much smaller (10% or less) than the annual fuel costs.
R&D Investment
R&D investment is tricky. The total R&D investment is a mixture of upfront costs to de-risk the science and develop the technology, and ongoing costs to service and improve systems after they're available.
In general, it doesn't really make sense to include upfront costs in an abatement cost.[14] Marginal abatement cost curves (like from McKinsey or the IEA) focus on decision-relevant deployment costs assuming the technology is available. But for an analysis of a new climate strategy, it makes sense to consider the upfront R&D to characterize the full social cost-benefit.
For this analysis, we consider both upfront and ongoing costs. We assume upfront R&D will be $250M amortized over 50 years,[15] and ongoing costs will add another $10M per year.
Read more details on R&D Investment
Upfront Costs
The major costs in R&D for contrails are (1) people, (2) trials, and (3) data. The major cost of (2) trials is same as operational contrail avoidance—the additional fuel. Given trials are a small fraction of global operational avoidance (typically involving 100s to 10,000s flights), the additional fuel burn in trials cumulatively is <<1% of the additional fuel burn at full scale.
We know of at least $40M in research funding allocated over the last few years through public EU and US research programs. It's likely that ~$100M of cumulative research funding has been put into contrails since the 1990s. We expect it will take a similar amount of effort to establish standardized contrail management practices. We estimate the total upfront R&D cost as $250M (Optimistic $200M, Pessimistic $500M).
We amortize the R&D over 50 years with a discount rate of 2%.[15:1] This annualizes to $8.0M per year (Optimistic $6.4M per year, Pessimistic $15.9M per year).
Ongoing Improvement
While the annualized upfront R&D makes little difference to the annual cost (its around 2% of the fuel cost), we need to consider what it will take to maintain and improve systems after contrail management is established. This includes improving forecasts and observation techniques to enable ever more efficient and effective mitigation strategies, and supporting validation and monitoring activities.
Considering our estimate of $40M in research funding allocation over the last few years, this implies a level of effort on the order of $10M per year globally. In terms of human resource cost, this is about 100 researchers at $100k per person. It turns out this is similar to the amortized R&D costs, but still modest compared to the fuel costs.
Given the size of contrail research events and conferences, 100 contrail researchers (100% focused on contrail avoidance) seems conservative–particularly if government-funded (e.g. University researchers) researchers are excluded from headcounts.
We estimate the ongoing R&D effort costs $10M per year (Optimistic $5M per year, Pessimistic $30M per year).
Estimated R&D Costs
The total annual R&D cost is simply the sum of the amortized upfront R&D + ongoing support.
Human Capital
Contrail management will require some amount of training and additional personnel (particularly at airlines and ANSPs) to be successful.
It's hard to estimate the added workforce without more significant airline and ANSP-led trials testing the additional load. We don't expect the long-term impact on personnel to be significant compared to other costs, but we can revisit this assumption with more data in the future.
For now, we make a level-of-effort estimate similar to the ongoing R&D and estimate $15M per year in added human capital cost across the industry.
Read more on the details of other Workforce costs
Depending on the design of operational contrail avoidance (e.g., airline-led or ANSP-led), there is potentially significant additional demand on airline flight planner or Air Traffic Controllers (ATCs). It's possible that this can be highly automated and absorbed into planner and controller workload. In this case, costs are simply investment in improvements in software and training.
Additional loading could be significant in some scenarios, but estimating the additional cost is very difficult without significant ANSP-led trials.
We aim to design navigational contrail avoidance to operate largely within Air Navigation Service Provider's (ANSP) existing resource capacity, at least at first. As such, it should only require modest additional personnel costs from controllers.
Minimizing controller workload is also pragmatic. It takes a long time to recruit and train new Air Traffic Controllers, and the rate is limited by the capacity of senior Air Traffic Controllers to train new controllers. We'd prefer to invest in efforts to improve air traffic management, which would enable expanded contrail management and reduce overall fuel burn up to 10%.
There are on the order of a 100 key airlines and 50 key ANSPs that each may need an aggregate ~1 additional person. Using the heuristic of $100k per person, this rolls up to about $15M per year in added human capital.
We estimate the additional human capital will cost $15M per year (Optimistic $5M per year, Pessimistic $30M per year).
Other Potential Costs
Flight Delay Time Costs
In principle, navigational avoidance could have a time impact on flights. The two most common types of deviation (horizontal at a fixed level, or vertically downwards on a fixed horizontal trajectory) have the opposite effects on time. Horizontal deviations usually mean longer flight distance and longer flight time; vertical deviations downward usually mean a higher true airspeed and shorter flight time.
Frías et al. 2024 found the time delay is extremely low (<<1%). Therefore, this impact has been omitted in this cost estimate.
Mitigation Potential
The broadly accepted central estimate of contrail warming (effective radiative forcing, ERF) is 57 mW / m2 (Lee et al. 2021). For the purposes of this post, we convert the warming from a year of contrail emissions to a CO2eq by asking how much CO2 we would have to emit to match the amount of heat trapped over the next 100 years.[16] Using the central-estimate ERF of 57 mW / m2, the warming from a year of contrails is equivalent to the warming from 652 million tonnes of CO2 (GWP-100).
The actual value of global annual contrail warming is hard to pin down. It depends on complex atmospheric interactions and varies year to year depending on meteorology patterns and air traffic. The Lee et al. study estimates contrail warming could be as low as 17 mW / m2 (192 million tonnes CO2eq) or as high as 98 mW / m2 (1,114 million tonnes CO2eq). Most recent estimates fall between these two values.[17]
In practice, navigational contrail avoidance will never be 100% effective—there will always be some residual contrail formation. We assume a 70% mitigation efficacy at full scale that captures errors in contrail forecasting and infeasible avoidance measures.
Read more on the details of Mitigation Potential
CO2 Comparisons
The most commonly accepted and cited figure for contrail warming at today's traffic levels is Lee et al. 2021. This study finds the ERF of contrail-cirrus globally (at 2018 traffic levels, similar to today) as 57.4 mW / m2 (5–95% likelihood range of (17.2, 97.6)). On a GWP-100 basis, a year of global contrail emissions produces warming equivalent to 652 million tonnes of CO2 (5-95% likelihood range of (195 million tonnes, 1109 million tonnes)).
Using a 100 year time horizon produces relatively conservative estimates of contrail CO2 equivalents; GWP-based CO2 equivalents with a shorter time horizon (e.g., 20 or 50 years) will be larger. However, some non-GWP equivalence metrics (particularly those that focus on warming at the end of a time period rather than over a time period) tend to produce lower CO2 equivalents than GWP-based metrics.
While GWP-100 is a common metric for considering abatement costs, this is less easy to contextualize for contrails given their radically different lifetimes (hours vs. centuries). In practice, removing contrail coverage on the planet (at today's traffic levels) is like an instantaneous removal of around 33 billion tonnes of CO2 from the atmosphere (assuming efforts to prevent contrails are maintained indefinitely). In temperature terms, accounting for future aviation growth and the lag in temperature response of the planet, contrail-cirrus is projected to warm the planet +0.06oC by 2050 (Smith et al. pre-print).
Efficacy
Navigational contrail avoidance will never be 100% effective—there will always be some residual contrail formation.[18]
However, it is difficult to extrapolate from small trials today to the potential efficacy of navigational avoidance once fully developed and scaled. In our study simulating the optimization of ~85,000 American Airline flight plans, we achieved 73% reduction in contrail warming. The remaining 27% was unavoidable under the constraints of the optimizer. It is likely that improvements in the optimizer (e.g., removing hard constraints) could improve this reduction. The Aviation Impact Accelerator assumed a success rate range of 60%–90% after scale-up, following a permission-to-deviate rate range of 85%-95%, yielding an overall efficacy of 51% - 86% (AIA 2024).
For these cost estimates, we assume a mitigation efficacy of 70% (Optimistic 80%, Pessimistic 50%) for contrail avoidance globally. This translates to 450 Mtonnes CO2eq (Optimistic 517 Mtonnes, Pessimistic 142 Mtonnes) avoided each year (at today's traffic levels). These figures account for the additional fuel burn in each scenario (at 3.89 kg CO2/kg additional fuel burn, ICAO's well-to-wake figure for Jet-A). If SAF is used, we don't have to account for additional fuel burn (but the fuel will cost more).
Conclusion
Given these assumptions, our overall model is simple. Add the annualized costs (additional fuel, infrastructure, R&D, and human capital) and divide by the CO2eq mitigation potential. Based on our nominal input assumptions, the result is a ~$1.75 per tonne CO2eq (GWP-100 basis).
With optimistic assumptions it's $0.50 per tonne CO2eq, or with pessimistic assumptions it's $14 per tonne CO2eq. Several other organizations have estimated an abatement cost on a similar order of magnitude.[19]
Dashboard
We built the following dashboard to show how input assumptions affect the cost of contrail management. See the dashboard source code for implementation details.
Footnotes
The ICAO SAF Rules of Thumb estimates the lowest SAF abatement cost around $200 / tonne CO2eq. The EU Emissions Trading System trades carbon around $60 / tonne CO2eq. The largest carbon removal plants sequester carbon around $1,000 / tonne CO2 today, but other methods in development promise to remove carbon closer to $50-$100 / tonne CO2. The 10-100x range in this statement is a function of the uncertainty in contrail and other abatement costs. ↩︎
All CO2eq in this post are calculated using a 100-year Global Warming Potential (GWP-100). For more context, see our earlier post on Comparing Contrails and CO2. ↩︎
In our global aviation emissions inventory, we found that flight trajectories are (on average) ∼5 % longer than the great circle path (shortest distance) between airports. Improving air traffic management could reduce fuel use by 10% across the industry. ↩︎
According to 2025 IATA Industry Statistics, 2025 airline revenues are forecast to be $979B and expenses $913B. ↩︎
When only considering the top ~3% flights that comprised the top 80% of contrail warming (big hits), we could achieve a 66% reduction in warming for only +0.05% fuel burn. ↩︎
For the big hits, the additional fuel made up 88% of the total cost. ↩︎
We're using U.S. gallons here (3.785 L). There are 0.264 gallons in a liter, 42 gallons in a barrel of oil, and 330 gallons in a metric tonne of Jet-A. If you prefer other units:
- $2.05/gal is $0.54/L, $86/barrel and $677/tonne
- $2.67/gal is $0.71/L, $112/barrel and $882/tonne
Revenue-tonne-km is sometimes used for cargo only, referred to as Cargo-Tonne-km (CTK). It's also frequently quoted for it's passenger only portion, Revenue-passenger-km (RPK). It's related to availability statistics, Available-Tonne-km (ATK) and Available-Seat-km (ASK) by load factors. Load factors are the proportion of the seats or total combined capacity (cargo & passengers) that was actually used. The combined load factor was around 71% globally in 2025. Passenger load factor on its own was higher (an incredible 84%). Availability statistics like ATK and ASK tell us about the available capacity in aviation, RTK and RPK tell us about the actual demand for aviation. ↩︎
If you prefer other units:
- 0.087 gal/RTK is 0.33 L/RTK and 11.9 MJ/RTK
If you prefer other units:
- 0.060 gal/RTK is 0.23 L/RTK and 8.2 MJ/RTK
- 0.068 gal/RTK is 0.26 L/RTK and 9.3 MJ/RTK
If you prefer other units:
- $2.00/gal is $0.53/L, $84/barrel and $660/tonne
- $2.05/gal is $0.54/L, $86/barrel and $677/tonne
- $2.80/gal is $0.74/L, $118/barrel and $925/tonne
A 2024 IATA Report breaks down the cost of the FLYHT WVSS-II sensor installation that is part of the AMDAR program. The one time certification cost for a new sensor is ~$250k. The sensor optimistically costs ~$20k + 60-80 man hours (~$10k) for the installation. Observation costs are $12k / year / aircraft. So to deploy a new humidity sensor to 1,000 aircraft would cost $20M up front and $12M / year for observations. ↩︎
This assumes we have generous fish-eye lens that can view 60km of sky. If we use low-cost unidirectional cameras, we'd likely need many more cameras. ↩︎
A lot of this cost has already been shouldered, and the funds generally come from government grants and philanthropic giving. ↩︎
The choice of timescale is a little arbitrary. It represents (roughly) the duration we think maintaining contrail avoidance is necessary. If we set the timescale shorter, the amortized upfront R&D is more expensive; longer and the R&D becomes cheaper. We set the R&D amortization time to 50 years, at which point new fuels, engines, and airframes will help solve the problem. We also used a discount factor of 2%, in-line with other calculations concerning the social cost of carbon (where the future costs of damages due to emissions are discounted back to today). ↩︎ ↩︎
The amount of heat trapped is referred to as a Global Warming Potential, or GWP, and doing this calculation using a time period of 100 years yields a CO2 equivalent on a GWP-100 basis. ↩︎
Appendix C in "The potential for climate-neutral growth" from The International Center for Clean Transportation (ICCT) has a good breakdown of recent studies looking at global annual contrail warming. All reported radiative forcing (RF) and effective radiative forcing (ERF) values fall within the Lee et al. bounds. ↩︎
It is possible that >100% warming reduction could be achieved as occasional individual cooling contrails could easily exceed residual warming contrails. ↩︎
Other industry reports:
- Aviation Impact Accelerator (2024). Five Years to Chart a New Future for Aviation: The 2030 Sustainable Aviation Goals. University of Cambridge.
- Rocky Mountain Institute (2024). Understanding Contrail Management: Opportunities, Challenges, and Insights.
- Transport & Environment (2024). Contrail avoidance: Aviation's climate opportunity of the decade.
- Roland Berger (2025). Contrails: A solvable problem?