
Ain't no sunshine where planes have gone
This post considers how much solar electricity is lost due to man-made contrail-cirrus clouds.
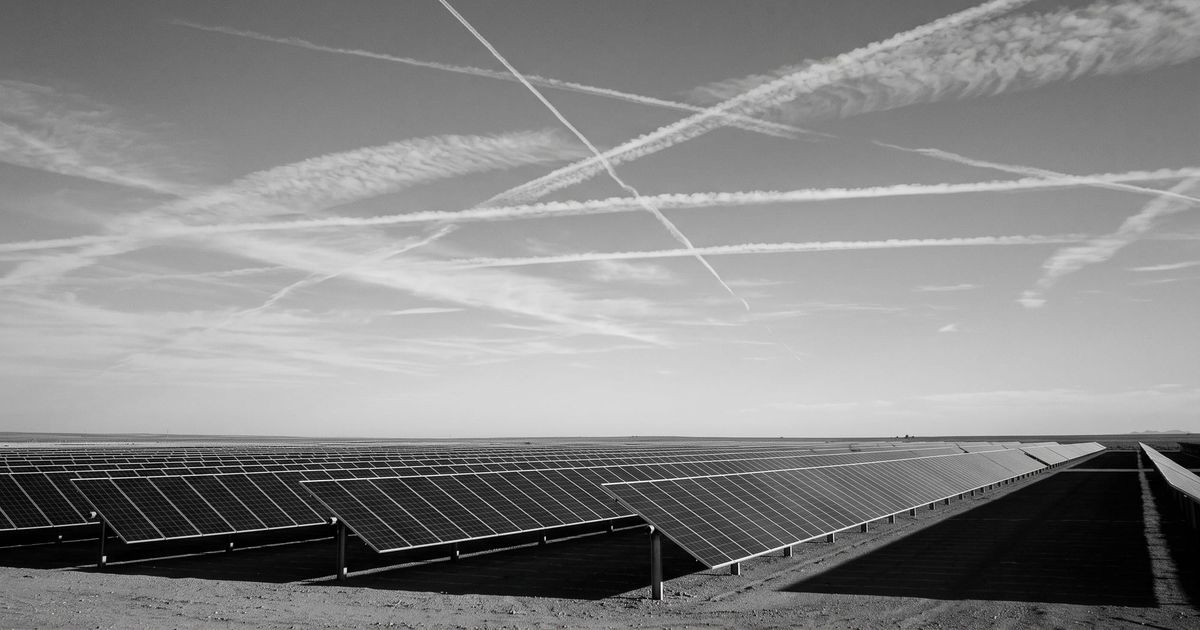
Contrails trap heat leaving the atmosphere, making them a significant climate concern. But in daylight, they also partially reflect sunlight before it reaches the ground, which means they are shading the world's solar panels. How much electricity does this cost? In this post, we work through a serious order-of-magnitude estimate to explore whether contrails affect the climate indirectly by reducing solar output.
Contrails and the cirrus they create interfere with radiation in two ways. They absorb outgoing longwave heat (OLR, a warming effect) and they reflect incoming shortwave sunlight back to space (RSR, a cooling effect). The warming effect happens all the time, but the cooling effect only happens when the sun is out.
These competing effects are why individual contrails can be net warming or cooling. Over all persistent contrails, the net warming effect dominates, which is why the man-made cloud blanket formed by contrails is a large climate problem.
But that shortwave reflection presumably has a side effect: sunlight that contrails bounce back to space is sunlight that never reaches a solar panel. So, how much potential solar power are we losing to contrails?
This feels like a question from Randall Munroe’s What If?, filed somewhere between "What if everyone on Earth jumped at once?" and "Could I cool down the Earth by capturing a comet and dropping it in the ocean, like an ice cube in a glass of water?". Surely, too trivial for anyone to have actually studied seriously.
However, one should never underestimate the breadth of the academic literature — there are at least two papers written on this topic.[1] Gruber et al. (2018) and Weihs et al. (2015) investigated the modeled and measured PV power drop on local solar panels in the presence of contrails. Both measured significant reductions in PV output in locations in Europe when shaded by persistent contrails. They find a contrail passing overhead could cut power output instantaneously by ~10%, while daily output on persistent-contrail days could be reduced by around 0.5% on average.[2] That said, we couldn't find an estimate of the total global solar power lost to contrail-cirrus.
Since there isn't a clear answer in the literature, we decided to do a What If?-inspired back-of-the-envelope calculation to get a sense of how much electricity contrails cost. Our intuition was that this surely must be a minuscule amount of power. It turns out it might be larger than we thought.
A rough estimate
In simulating contrail formation on every flight in 2019, Teoh et al. (2024) estimates the global-mean contrail shortwave radiative forcing at about −64 mW/m2. This means on average, contrails reflected 64 mW of incoming sunlight per square-meter of Earth throughout 2019. This is a small number compared to the 341 W/m2 mean solar radiation reaching contrails (approximately the same as the insolation at the top of the atmosphere) on the same global annual basis.[3]
So contrail cirrus dims the sunlight reaching the Earth's surface by about:
Losing 0.02% is obviously a very small fraction of solar power. But solar power generation is a very large (and rapidly increasing) number. A small fraction of a large number may not be all that small.
Global solar generation in 2025 was around 2,800 TWh (terawatt-hour, or one billion kWh, the standard unit of electricity).[4] Taking 0.02% of that yields ~0.5 TWh per year of lost solar generation.
This is roughly enough energy to power 50,000 U.S. homes for a year, or enough energy to drive an electric car the distance from the Sun to Uranus![5] But most of us don’t work in units of terawatt-hours (TWh), so it's worth putting this number in the context of aviation and contrail avoidance.
The dominant cost in every contrail-avoidance cost-benefit analysis (including our own) is the additional fuel burned when aircraft fly around a contrail-forming region. Like the potential lost solar power, the added fuel is also a small fraction of a big number.
Based on studies and trials, we estimate the added fuel to be 0.1% to 0.5% of fleet-wide fuel, with a central estimate at 0.3%.[6] However, in 2025, the global airline industry consumed 104 billion gallons of jet fuel, at a cost of $252 billion, releasing ~1 billion tonnes of CO2 in the process.[7] So how can we compare the cost of avoidance to the lost solar energy?
Energy
Jet fuel and electricity are not directly interchangeable, so one should be careful comparing electrical energy and fossil fuel energy (see the Primary Energy Fallacy). But for a sense of scale, commercial aviation used around 3,700 TWh of jet fuel in 2025.[7:1] A 0.3% fuel penalty due to contrail avoidance (at 2025 global scale) would therefore require an additional ~11 TWh.
Value
At 5 cents per kWh, 0.5 TWh of solar power is (very approximately) about $25M per year of lost generation.[8] Our central estimate for the total cost of contrail avoidance (at 2025 global scale) is $785M per year (mostly in fuel).
Emissions
If 0.5 TWh of lost solar would otherwise have displaced gas-fired generation (around 600 gCO2 per kWh), it is worth about 0.3 Mtonnes CO2 per year. Against the average global grid (a more conservative counterfactual), it is closer to 0.22 Mtonnes CO2 per year.[9] By comparison, our central estimate for the added emissions from contrail avoidance is around 3 Mtonnes CO2.[10]
A slightly better estimate
This quick first-order estimate obviously makes a few big assumptions. But even with these assumptions, 0.5 TWh is larger than we expected. Given this isn't entirely negligible when compared to the cost of contrail avoidance, let's dig in a little deeper to refine this estimate.
Where do contrails form vs where are solar panels?
The first-order estimate quietly assumes solar panels are spread evenly under average sky. They are obviously not — to start, solar farms are built on land!
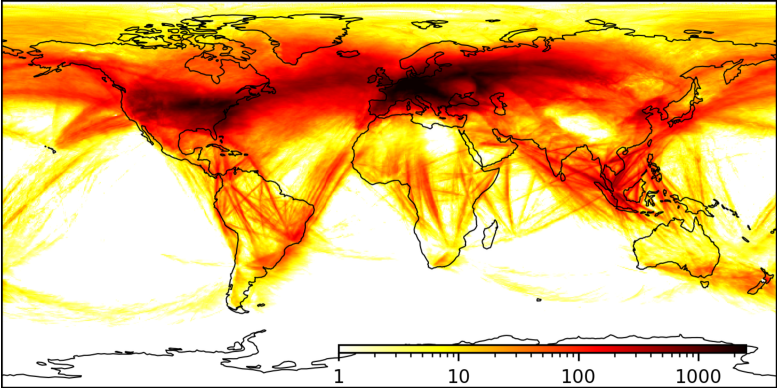
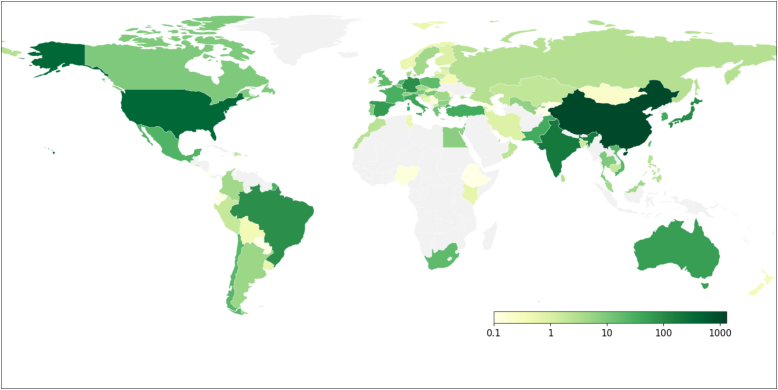
We can do better by using the regional breakdown from Teoh et al. (2024). Alongside the global mean, this paper reports the contrail shortwave forcing for a set of geographic bounding boxes. We can pair each box with that region's 2025 solar generation and its typical top-of-atmosphere sunlight to get a regional estimate of solar power lost.
The United States, as an example, has a regional average contrail shortwave forcing of −485 mW/m2, about 7.6 times the global mean. Compared to US insolation of roughly 335 W/m2 (assuming an average latitude of ~38°N), this represents a 0.14% dimming. Applied to the ~390 TWh of solar the US generated in 2025,[11] the US alone loses ~0.5 TWh per year — as much as our entire naive global estimate. Doing the same across the major regions: [12]
| Region | Contrail SW forcing (mW/m²) |
Mean TOA insolation (W/m²) |
Sunlight dimmed |
2025 solar (TWh) |
Solar lost (TWh) |
|---|---|---|---|---|---|
| USA | −485 | 335 (~38°N) | 0.14% | 389 | 0.56 |
| Europe | −1,160 | 300 (~46°N) | 0.39% | 385 | 1.49 |
| China | −87.8 | 345 (~35°N) | 0.03% | 1,175 | 0.30 |
| India | −35.6 | 385 (~22°N) | 0.01% | 180 | 0.02 |
| Indonesia | −83.8 | 415 (~0°) | 0.02% | 2 | <0.01 |
| South America | −14.7 | 395 (~18°S) | <0.01% | 120 | <0.01 |
| Africa | −20.0 | 370 (~28°S) | 0.01% | 30 | <0.01 |
| Rest of World | −63.7 | 340 | 0.02% | 497 | 0.09 |
| Total | 2,778 | ~2.5 |
The result is striking. Summed across regions, the global loss is roughly ~2.5 TWh per year, around five times the naive global-mean figure. Solar panels and contrails, it turns out, overlap better than we assumed because both cluster in the northern mid-latitudes.
The table is dominated by a single row: Europe accounts for ~60% of the total. Europe stacks the highest contrail forcing (some eighteen times the global mean) on the lowest baseline sunshine (high-latitude) and a large installed fleet of solar panels. That combination is also why Europe is the least certain row: we have applied the traffic-dense box-average forcing to all European panels, which probably overstates the shading over the sunnier Spanish and Italian solar farms, so the true European figure (and hence the total) may be somewhat lower. Conversely, German traffic density and solar output is relatively high. A gridded convolution of the contrail forcing field (ideally as a function of time too) against a solar-capacity map would be the proper way to assess this factor in depth.[13]
Growth
Solar is growing at a startling pace, currently doubling every ~3 years, with generation projected to reach around 6,000 TWh by 2030 and 10,500 TWh by 2035.[14] Air traffic (and therefore contrail coverage) is also growing, at perhaps 3% to 4.5% per year depending on which crystal ball you believe.[15]
Combining a bigger loss fraction with a bigger pie, 2.5 TWh of lost solar power in 2025 grows to roughly 6.2 TWh by 2030, and around 13 TWh by 2035, assuming solar panels and contrails continue to experience similar levels of overlap.
Cloud and atmospheric interactions
Our rough estimate makes several approximations involving clouds and other atmospheric losses: the natural cirrus that contrails suppress; the light they scatter; and the difference between changes in shortwave radiation at the top-of-atmosphere compared with the surface:
(1) Suppression of natural clouds. Contrail cirrus does not just add ice, it suppresses some natural cirrus that would otherwise have formed. This lets a little more sunlight through on average, and partly offsets some of its own dimming. Using some of the literature on these feedback effects, we can estimate that this effect might reduce the solar power losses by ~20%.
(2) Scattering into diffuse light. As well as reflecting sunlight, contrails scatter some of the direct solar beam into diffuse light. Solar panels (especially tilted or sun-tracking ones) are less efficient with diffuse beams than direct ones. Using measurements of PV power reduction under contrails, accounting for this effect could add ~20% to our estimate of solar power losses.
(3) Surface sunlight changes vs top-of-atmosphere. The figures used above for reflection of sunlight by contrails (typically formed during cruise at ~30,000 to 40,000 feet) are actually changes in shortwave radiation at the top of the atmosphere. This is correct for considering the Earth’s energy balance, but not always quite what a panel on the surface sees. What matters for solar power is the change in light reaching the ground. To first approximation these are the same: a contrail dims incoming solar radiation by a fixed fraction, reducing sunlight proportionally all the way down to the surface. Deviations in practice from this simplification (a little sunlight lost above the contrail, reflection from cloud and bright ground below it) mostly cancel or occur where solar panels generate little power (e.g. under thick cloud cover). However, accounting for them would increase our estimate of losses — although significantly less than either of the above effects.
These effects are small compared to other uncertainties in our estimate. A more complex model breaking down time and geography more finely might find one or more of these effects outweigh the others at certain times and locations. However, for our rough estimate of solar power losses, they approximately cancel each other out.
Technical details on cloud & atmospheric interactions
Suppression of natural clouds
The suppression of natural clouds is one of the rapid adjustments folded into ERF, which is used to convert numbers produced by contrail evolution models like CoCiP into equivalent CO2 impacts or impacts on surface temperature.
Using Bickel (2023)'s decomposition of rapid adjustment effects due to contrails, the relevant part concerning reflection of sunlight is worth about a 20% reduction on the raw dimming used in our estimates.[16] The exact fraction lost to the rapid feedback effects for this application has a large uncertainty, but it most certainly will take a chunk out of the raw numbers above.
Scattering into diffuse light
Contrails do not only reflect sunlight — they also scatter direct light beams into diffuse light. A solar panel, and especially a tilted or sun-tracking one, converts the direct beam more efficiently than diffuse light, so its output falls by a little more than the drop in total shortwave alone would suggest. Both Gruber et al. (2018) and Weihs et al. (2015) observed this effect directly: both their modeled and measured solar power drops somewhat more than the total surface shortwave radiation because the direct component becomes diffuse.
In Gruber et al. (2018), midday PV power output on their fixed 35° panel fell by up to ~10%, around 40% higher than the drop in total surface shortwave radiation (~7%). That increase in loss is zero for a flat horizontal panel (which still captures the diffuse light) and largest for sun-tracking systems, which depend most on the direct beam. Averaged across a real solar PV fleet of fixed-tilt, a growing share of single-axis trackers, and rooftop, we might approximate the loss on average to be ~20%. Weihs et al. (2015) measured the yield loss directly and see the same effect. Our estimate treats the shortwave forcing as a straight proxy for lost generation, so accounting for this would increase our estimate of lost solar power, growing as single-axis tracking spreads through the sunny, panel-dense regions that matter most.
Surface sunlight changes vs top-of-atmosphere
The figures used in our estimate of solar power loss for the shortwave radiative forcing of contrails (typically formed during cruise at ~30,000 to 40,000 feet) are actually changes in shortwave radiation at the top of the atmosphere. This change at the top-of-atmosphere tells us how much less solar energy is now absorbed by the atmosphere and surface (combined), thanks to contrails reflecting light. This is an appropriate control volume if you are interested in the energy balance of the Earth system (the normal use-case for thinking about contrails).
However, in estimating solar power loss, we only really care how much absorption of light we lose at the surface, where the solar panels are, not the atmosphere and surface combined. Primarily the error in using the change in shortwave flux at the top-of-atmosphere is that in some circumstances, contrails don’t just reduce the net amount of shortwave radiation absorbed by the Earth’s atmosphere and surface, but also move the ratio of how much is absorbed by the surface vs. how much is absorbed by the atmosphere.
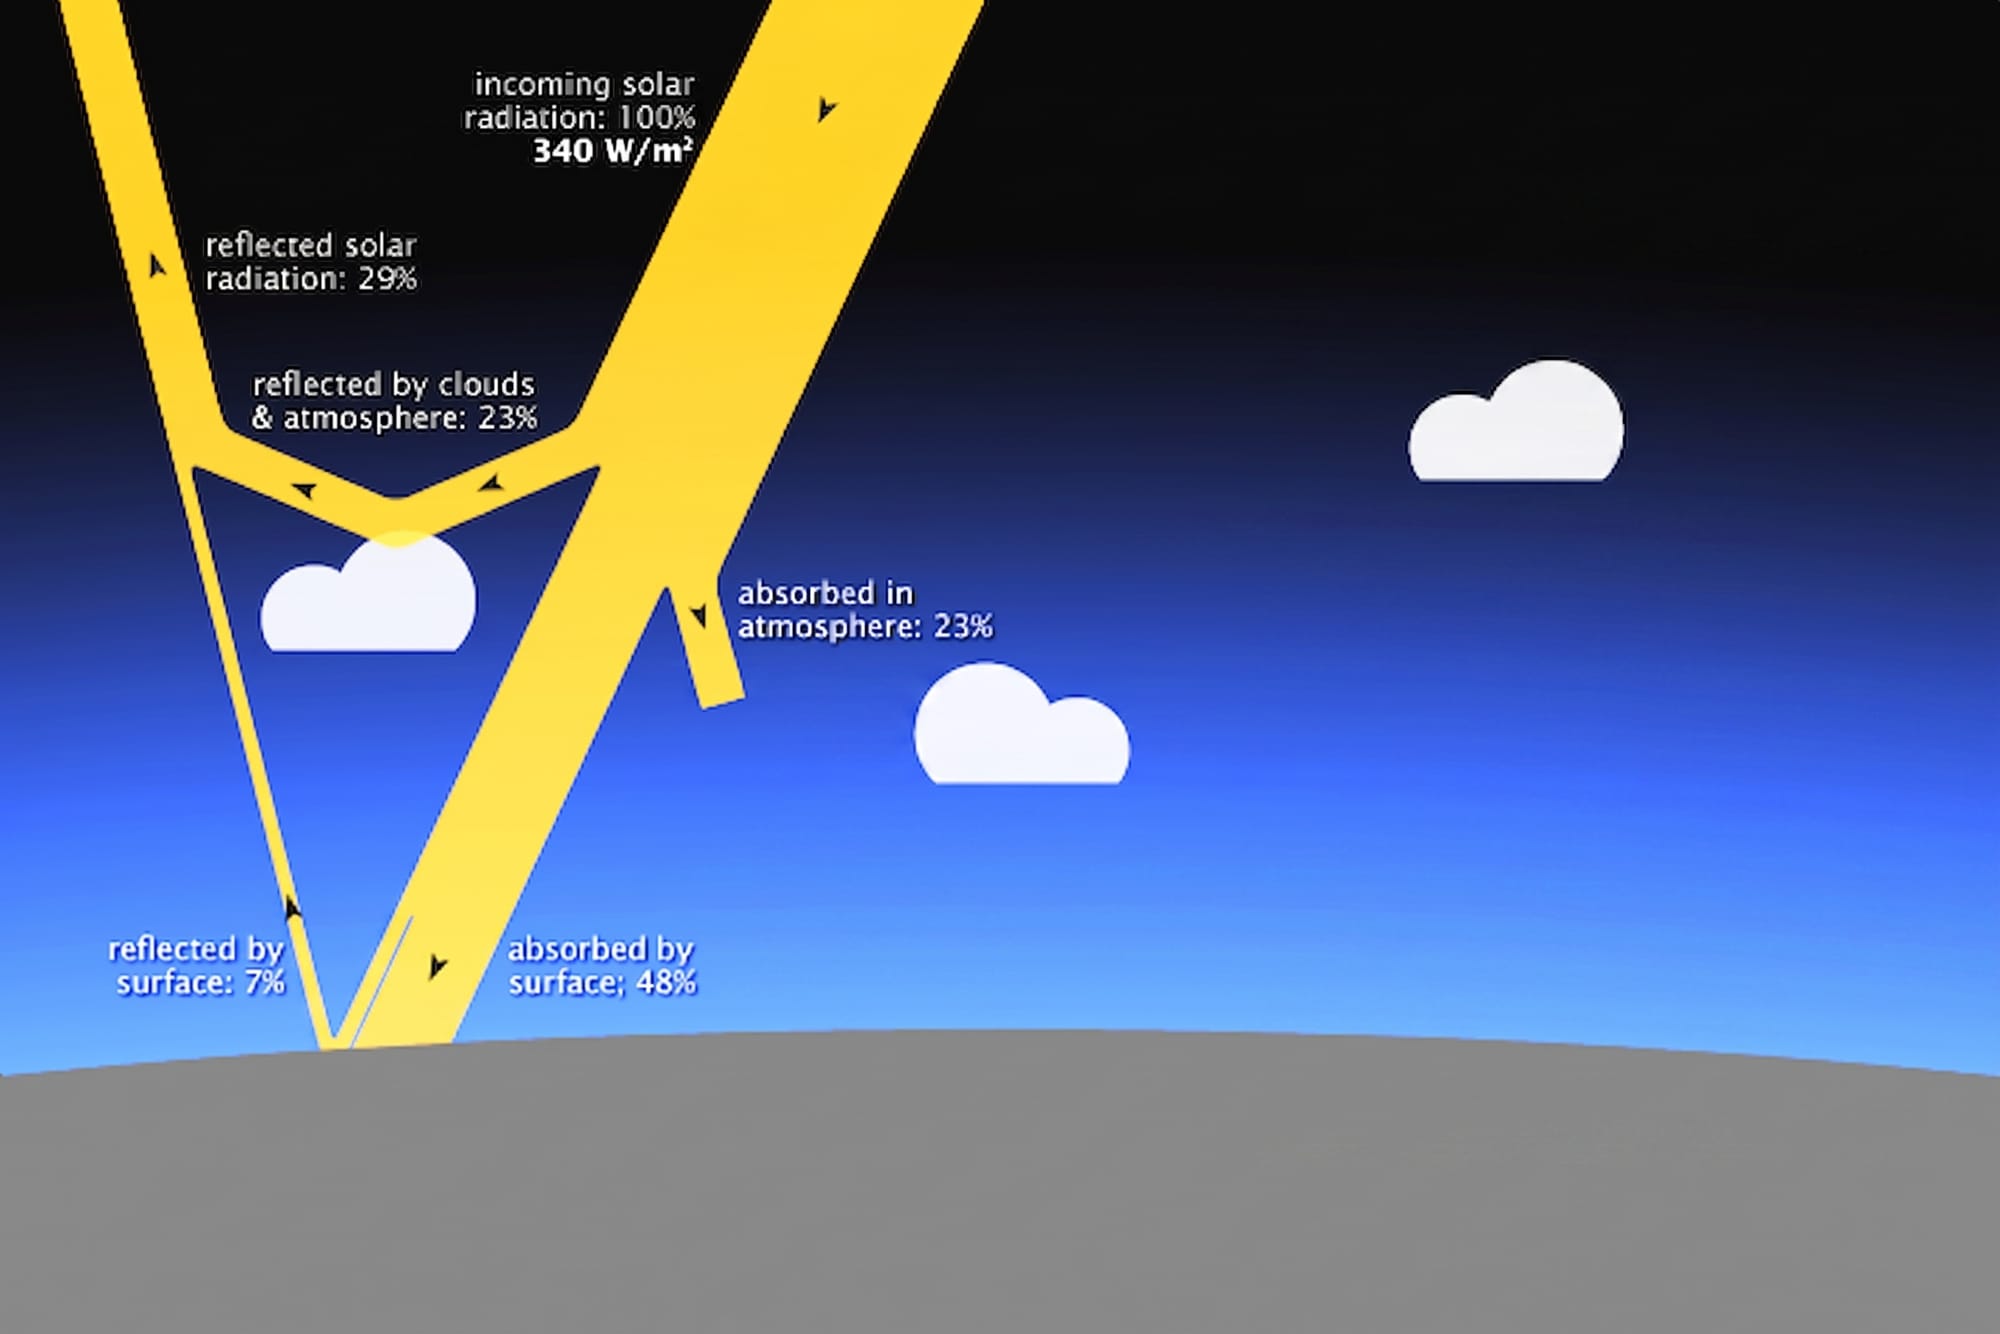
Approximately a quarter of incoming solar radiation is lost to absorption by the atmosphere. Most of this is absorbed by water vapor, which is almost entirely concentrated in warmer, lower altitudes, below persistent contrails (the stratosphere is extremely dry).
A small fraction of absorption in the atmosphere is by stratospheric ozone above contrails, primarily in the ultraviolet (UV) wavelengths (hence the importance of the ozone layer). However, UV isn’t utilized by solar panels. Our estimates of radiative forcing, used for considering the Earth’s energy balance, care about the total energy from all wavelengths, not just those that are used by PV panels. The outputs of CoCiP, therefore, don’t distinguish between these wavelengths.
Around a further quarter of incoming solar radiation, on average, is reflected back to space by clouds. Most of these clouds are below cruise altitudes where contrails persist, but high cirrus can also exist above contrails.
Finally, the Earth’s surface also reflects some of the solar radiation that reaches it. Dark solar panels themselves reflect very little, although the ground around them and between them might (e.g. sand).
Contrails reflect shortwave radiation coming from above the contrails back to space, but also shortwave radiation coming from below the contrails (radiation reflected by low clouds or the surface) back towards Earth. When there is high amounts of Reflected Solar Radiation (RSR) from clouds and the surface in the radiative transfer model in CoCiP (from ERA5 data), this reduces the change in shortwave radiative flux we calculate at the top-of-atmosphere due to contrails. However, some of this reduction in shortwave flux leaving the atmosphere is because adding reflective contrails increases the path length of light through the atmosphere (light now bouncing between reflective contrails, low clouds and the surface), thereby increasing the amount of shortwave radiation absorbed by the atmosphere. As such, this hides some of the loss of sunlight available to be absorbed by the surface, caused by contrails.
If there are significant losses in shortwave radiation above the level of the contrails (e.g. high cirrus, or ozone reducing UV energies), the impact of contrails on shortwave radiation reaching the surface is slightly larger than that at top-of-atmosphere. Sunlight reflected by the contrail will undergo some losses through absorption or reflection as it travels back towards space. Again, this increases the absorption of shortwave radiation by the atmosphere, thereby reducing the amount of radiation that reaches the surface.
In our estimate, we assumed that the dimming at the surface was proportionally the same as at the top-of-atmosphere. This is accurate if there are negligible shortwave losses above the contrail, and below the contrail there isn’t lots of reflection from clouds or the surface. Accounting for deviations from this behavior would slightly increase our estimate of solar power loss, although conveniently much of the time, these deviations in behavior from ideality correlate with times when solar panels produce little power anyway (e.g. thick cloud cover). To calculate this properly, a new radiative transfer model (e.g. in CoCiP) would have to be built to look at losses of shortwave radiation of relevant wavelength at the surface, not at the top-of-atmosphere. However, this isn’t a trivial exercise suited to this estimate.
Other uncertainties
It's worth reiterating that this is a rough order-of-magnitude estimate. All the numbers above are based on shortwave radiative forcing modeled using CoCiP. There are many assumptions in this model and the datasets it’s built on (e.g. ignoring the 3-dimensional impact of contrails on radiation[17]), discussed at length in Teoh et al. (2024). It's important to remember that uncertainties cut both ways: the "true" number could be bigger or smaller.
Nuances
It is tempting to read all this as a renewed argument for contrail avoidance — dodge the contrails, get the sunshine back. However, navigational avoidance targets strongly net-warming contrails, which are dominated by longwave radiative heating and hence occur disproportionately at night.
The contrails that dominate the shading of solar panels are, by definition, the ones with large daytime shortwave components. These contrails may even be net-cooling, exactly the ones an efficacy-based scheme would attempt to leave alone. So the lost solar and the recoverable warming may be quite different populations of contrail.
There is quite a lot of nuance here, and a more detailed calculation would be needed to look at the likely impact of wide-spread contrail avoidance on recovering solar power loss. While night-time contrails are disproportionately warming, most air traffic is during the day, so there are plenty of net-warming contrails that shield solar power too.
In terms of solar value, timing matters. Solar power peaks in the middle of the day, when small amounts of lost generation are worth less than in the evening hours, when electricity tends to be most valuable.
So what?
Losing ~2.5 TWh of solar power in 2025 (and up to ~13 TWh in 2035) is much more significant than we expected when we started thinking about this analysis. Based on our simple approximations, solar losses from contrails could be worth ~$600 million a year in lost power by 2035, a very similar magnitude to the total cost of global contrail avoidance. The emissions lost to this solar power reduction (if it would otherwise have displaced gas-powered generation) could be worth ~8 Mtonnes CO2 annually, around double the estimated ~4 Mtonnes CO2 emissions of a 0.3% fleet-wide fuel burn penalty in 2035.
But broadly speaking, the contrails that shield solar power are not the contrails we seek to avoid. If you care most about the solar losses, you would avoid contrails in only a few specific places (i.e. near large solar farms). Interestingly, given the relatively low cost of navigational avoidance, solar farms underneath major flight corridors probably should have an interest in promoting contrail avoidance in the airspace above them.
The big argument here is about perspective. Contrail avoidance will take some cost to implement, and we need to get it right. But the costs of implementation are measured in fractions of a percent — some extra time planning, a small amount of added fuel, and a small knock-on to air-traffic flow. While it's critical to measure and understand these, they are arguably secondary to reducing the social cost of contrail warming.
This estimate of solar power loss shows that contrails have fractional, second-order impacts of comparable magnitude across the system in both directions. Lost solar power generation is one we happened to be able to identify and estimate here. Its value might not be as a lever, but as a sense of proportion. While we weigh the relatively minor costs of clearing the sky, it's worth considering how many other costs are hiding under that same sun.
If you want to find out more about what we're doing at the moment to clear the sky of contrails, read about the recent launch of the aptly-named "Operation Blue Skies" programme in our last post
Footnotes
As an aside, this xkcd comic by Randall Munroe is used as a reference in my own PhD thesis, somewhat fittingly closing this loop. ↩︎
Gruber et al. (2018) conducted a regional COSMO-ART case study over Central Europe (3 December 2013), and found that contrails cut surface shortwave by up to ~15 W/m2 (5 to 10% under the densest cover) and reduced normalized PV power by up to 10% around midday. PV fell somewhat more than total shortwave, because the direct beam was preferentially scattered into diffuse. Weihs et al. (2015) conducted one year of ground-based irradiance and PV measurements at Kanzelhöhe Observatory, Austria. They found that an individual contrail crossing the sun reduced global irradiance by up to 72% instantaneously (mean reduction ~8% during obstruction events). The mean daily PV yield loss on persistent-contrail days was ~0.35 to 0.44%, up to ~2 to 3% on the worst days. ↩︎
Global annual-mean incoming solar radiation at the top of the atmosphere is about 340 W/m2 (341 W/m2 in the canonical Earth energy budget of Trenberth, Fasullo & Kiehl 2009) — a quarter of the ~1,361 W/m2 solar constant, since the sunlit disc (πr²) is spread over the whole rotating sphere of the Earth (4πr²). Only about 55% of this reaches the surface (184 W/m2 in the same budget), the rest reflected by clouds and surface or absorbed in the atmosphere. ↩︎
Global solar generation reached 2,778 TWh in 2025, up 636 TWh (+30%) on 2024 (Ember, Global Electricity Review 2026). Generation by country can be browsed at Our World in Data (Ember 2026 and Energy Institute, CC BY). For orientation, China generated 1,175 TWh and the United States 389 TWh in 2025, and global solar output is now roughly the size of the EU-27's entire electricity demand. Interestingly, historical predictions, even very short term ones, have routinely been found to significantly underestimate the growth of solar again and again. ↩︎
I have heard the charging network is really quite poor past Mars. ↩︎
See The Cost of Contrail Management. We estimate additional fuel burn of 0.1% to 0.5% of fleet-wide fuel (central 0.3%) for navigational avoidance at scale. Some recent work suggests this number will be on the lower end (which is what we want!), but ongoing trials will provide a stronger base of evidence. ↩︎
Commercial aviation burned about 104 billion gallons of jet fuel in 2025, or ~315 Mtonnes (IATA industry statistics). At jet fuel's calorific value of ~12 kWh/kg, that is roughly 3,700 TWh of chemical energy. Tank-to-wake, a kg of jet fuel releases 3.15 kg CO2, meaning in 2025, ~1 billion tonnes CO2 left the exhausts of commercial aircraft. ↩︎ ↩︎
$50 per MWh is a round wholesale value for electricity. The true figure varies enormously by market, time of day, and curtailment (see IEA Statistics). This also assumes the marginal solar generation would have been used rather than curtailed, which increasingly is not guaranteed at high solar penetration (although increased use of battery storage combined with solar PV would mean that this extra generation could be stored for use later). As such, this is a very approximate order-of-magnitude value. ↩︎
Gas-fired power generation emits on the order of 600 gCO2 per kWh (including upstream methane leakage on a GWP-100 basis), which we use for the gas-displacement case. The average global grid intensity was 445 gCO2 per kWh in 2024, and falling (IEA, Electricity 2025), which we use as the more conservative counterfactual. The correct factor depends on what electricity source the extra solar actually displaces. ↩︎
In pursuit of avoiding hundreds of millions of tonnes of CO2 equivalent contrail warming (GWP-100). ↩︎
US solar generation in 2025 was about 296 TWh utility-scale plus about 93 TWh small-scale, roughly 390 TWh total. U.S. Energy Information Administration. ↩︎
Each region's contrail shortwave forcing is the annual-mean value for the corresponding bounding box in Teoh et al. (2024), Table 2 (Indonesia is approximated with the South-East Asia box, Africa with the Africa & Middle East box, and Rest of World with the global mean). 2025 solar generation data from Ember: China 1,175 TWh, USA 389 TWh, India ~180 TWh, Brazil-led South America ~120 TWh, Africa ~30 TWh, Indonesia ~2 TWh. Europe uses the EU-27's record 369 TWh (European Electricity Review 2026) plus ~15 TWh of UK and other non-EU European generation. Rest of World is the global total (2,778 TWh) minus the named regions. Insolation here is the annual-mean solar radiation at the top of the atmosphere for each region's approximate latitude. This follows almost exactly from orbital geometry — the global mean is ~340 W/m2, ranging from ~416 W/m2 at the equator to ~208 W/m2 at the Arctic Circle. As such, the only real approximation is the capacity-weighted mean latitude we assign each region (for example ~46°N for the Germany-heavy European fleet, giving ~300 W/m2). Europe's combination of the highest forcing and the lowest top-of-atmosphere sun (a consequence of its high latitude) makes it both the highest loss region and the most uncertain, since applying the traffic-dense box-average forcing to all European panels probably overstates the shading over the sunnier Spanish and Italian PV fleets. ↩︎
We probably have all the data we need to conduct this analysis, but we considered it beyond the scope of this Notebook post. If this is of interest, we can share data and analyses identifying the times and regions with bigger solar losses. ↩︎
Ember reports that since 2015 solar output has grown more than tenfold, roughly doubling every three years, reaching 2,778 TWh in 2025 (Global Electricity Review 2026). For 2030, the IEA's Electricity 2026 expects solar PV to add more than 600 TWh of generation per year on average, reaching roughly 6,000 TWh. For 2035, BloombergNEF's New Energy Outlook 2025 base case has combined wind and solar capacity reaching ~12.6 TW, consistent with solar generation on the order of 10,000 to 11,000 TWh. Extending the IEA/Ember trend (with some slowing) gives a similar ~10,500 TWh. Across scenarios the range is roughly 9,000 to 13,000 TWh, and such projections have historically tended to underestimate solar's actual growth. ↩︎
Long-term traffic growth forecasts cluster around 3% to 4.5% per year: Airbus GMF 2025 at 3.9% and Boeing CMO at ~4.0% (2019–2040), IATA at 3.1% to 3.3% CAGR (2024–2050), ICCT's central case at 3%, and ICAO/ACI up to ~4.2% for RPK. We take the lower end as a proxy for contrail-cover growth, consistent with Smith et al. (2026), who model the growth of aviation's contrail warming forward to 2050 under projected traffic. ↩︎
The effective radiative forcing of contrail cirrus is lower than the instantaneous RF because of rapid adjustments, chiefly a reduction in natural cirrus. From the shortwave-specific part of the adjustment decomposition in Bickel et al. (2020) and Bickel (2023), the natural-cloud response brightens the surface enough to offset roughly 20% of the raw shortwave dimming. Across all the rapid adjustments combined, the shortwave reduction from stratosphere-adjusted RF to ERF in this simulation is approximately 23% (95% confidence interval 9% to 37%, from inter-annual variability). Note this is a climate-model adjustment applied to a contrail-tracking RF, so the two are not strictly like-for-like. Other literature (e.g. Juvin-Quarroz et al. (2026)) also discusses the significant uncertainty in these atmospheric adjustments, and the differences between studies. ↩︎
In its radiative transfer model, CoCiP treats each contrail as a plane-parallel, one-dimensional layer. This misses the impact of radiation entering or leaving through the sides of a contrail. Carles et al. (2025) show these three-dimensional effects can be a large fraction of a contrail's shortwave forcing, and that whether accounting for the three-dimensionality of the contrail increases or decreases the dimming a contrail causes depends on the sun's position. With a high sun, some light scatters out through the sides heading towards the ground. As such, in the middle of the day, the real contrail dims less than the one-dimensional model in CoCiP predicts. Conversely, with a low sun the sunlit flank of the contrail intercepts more light (dimming more), albeit this is also when solar panels generate a lot less anyway. For our purposes, the effect of this is limited. Firstly, the reduction in dimming is most significant in the middle of the day at the equator; most of our solar losses occur at mid- or high latitudes (e.g. Europe) where the effect of extra sunlight leaking out the sides of contrails is much more muted. Second, the light that does leak out the sides at high sun angles is scattered into diffuse light that most solar farms are less efficient at capturing, reducing the benefit of this leakage. Third, these 3D effects are largest for young, narrow contrails and fade as contrails spread into wider contrail cirrus. Most of the total radiative forcing is due to the aged, very wide (i.e. effectively nearly one-dimensional) contrail cirrus. A separate, three-dimensional effect from the internal patchiness of spread contrail cirrus (holes and filaments) is not captured by either CoCiP or Carles et al. (2025), and remains an unquantified uncertainty. ↩︎